

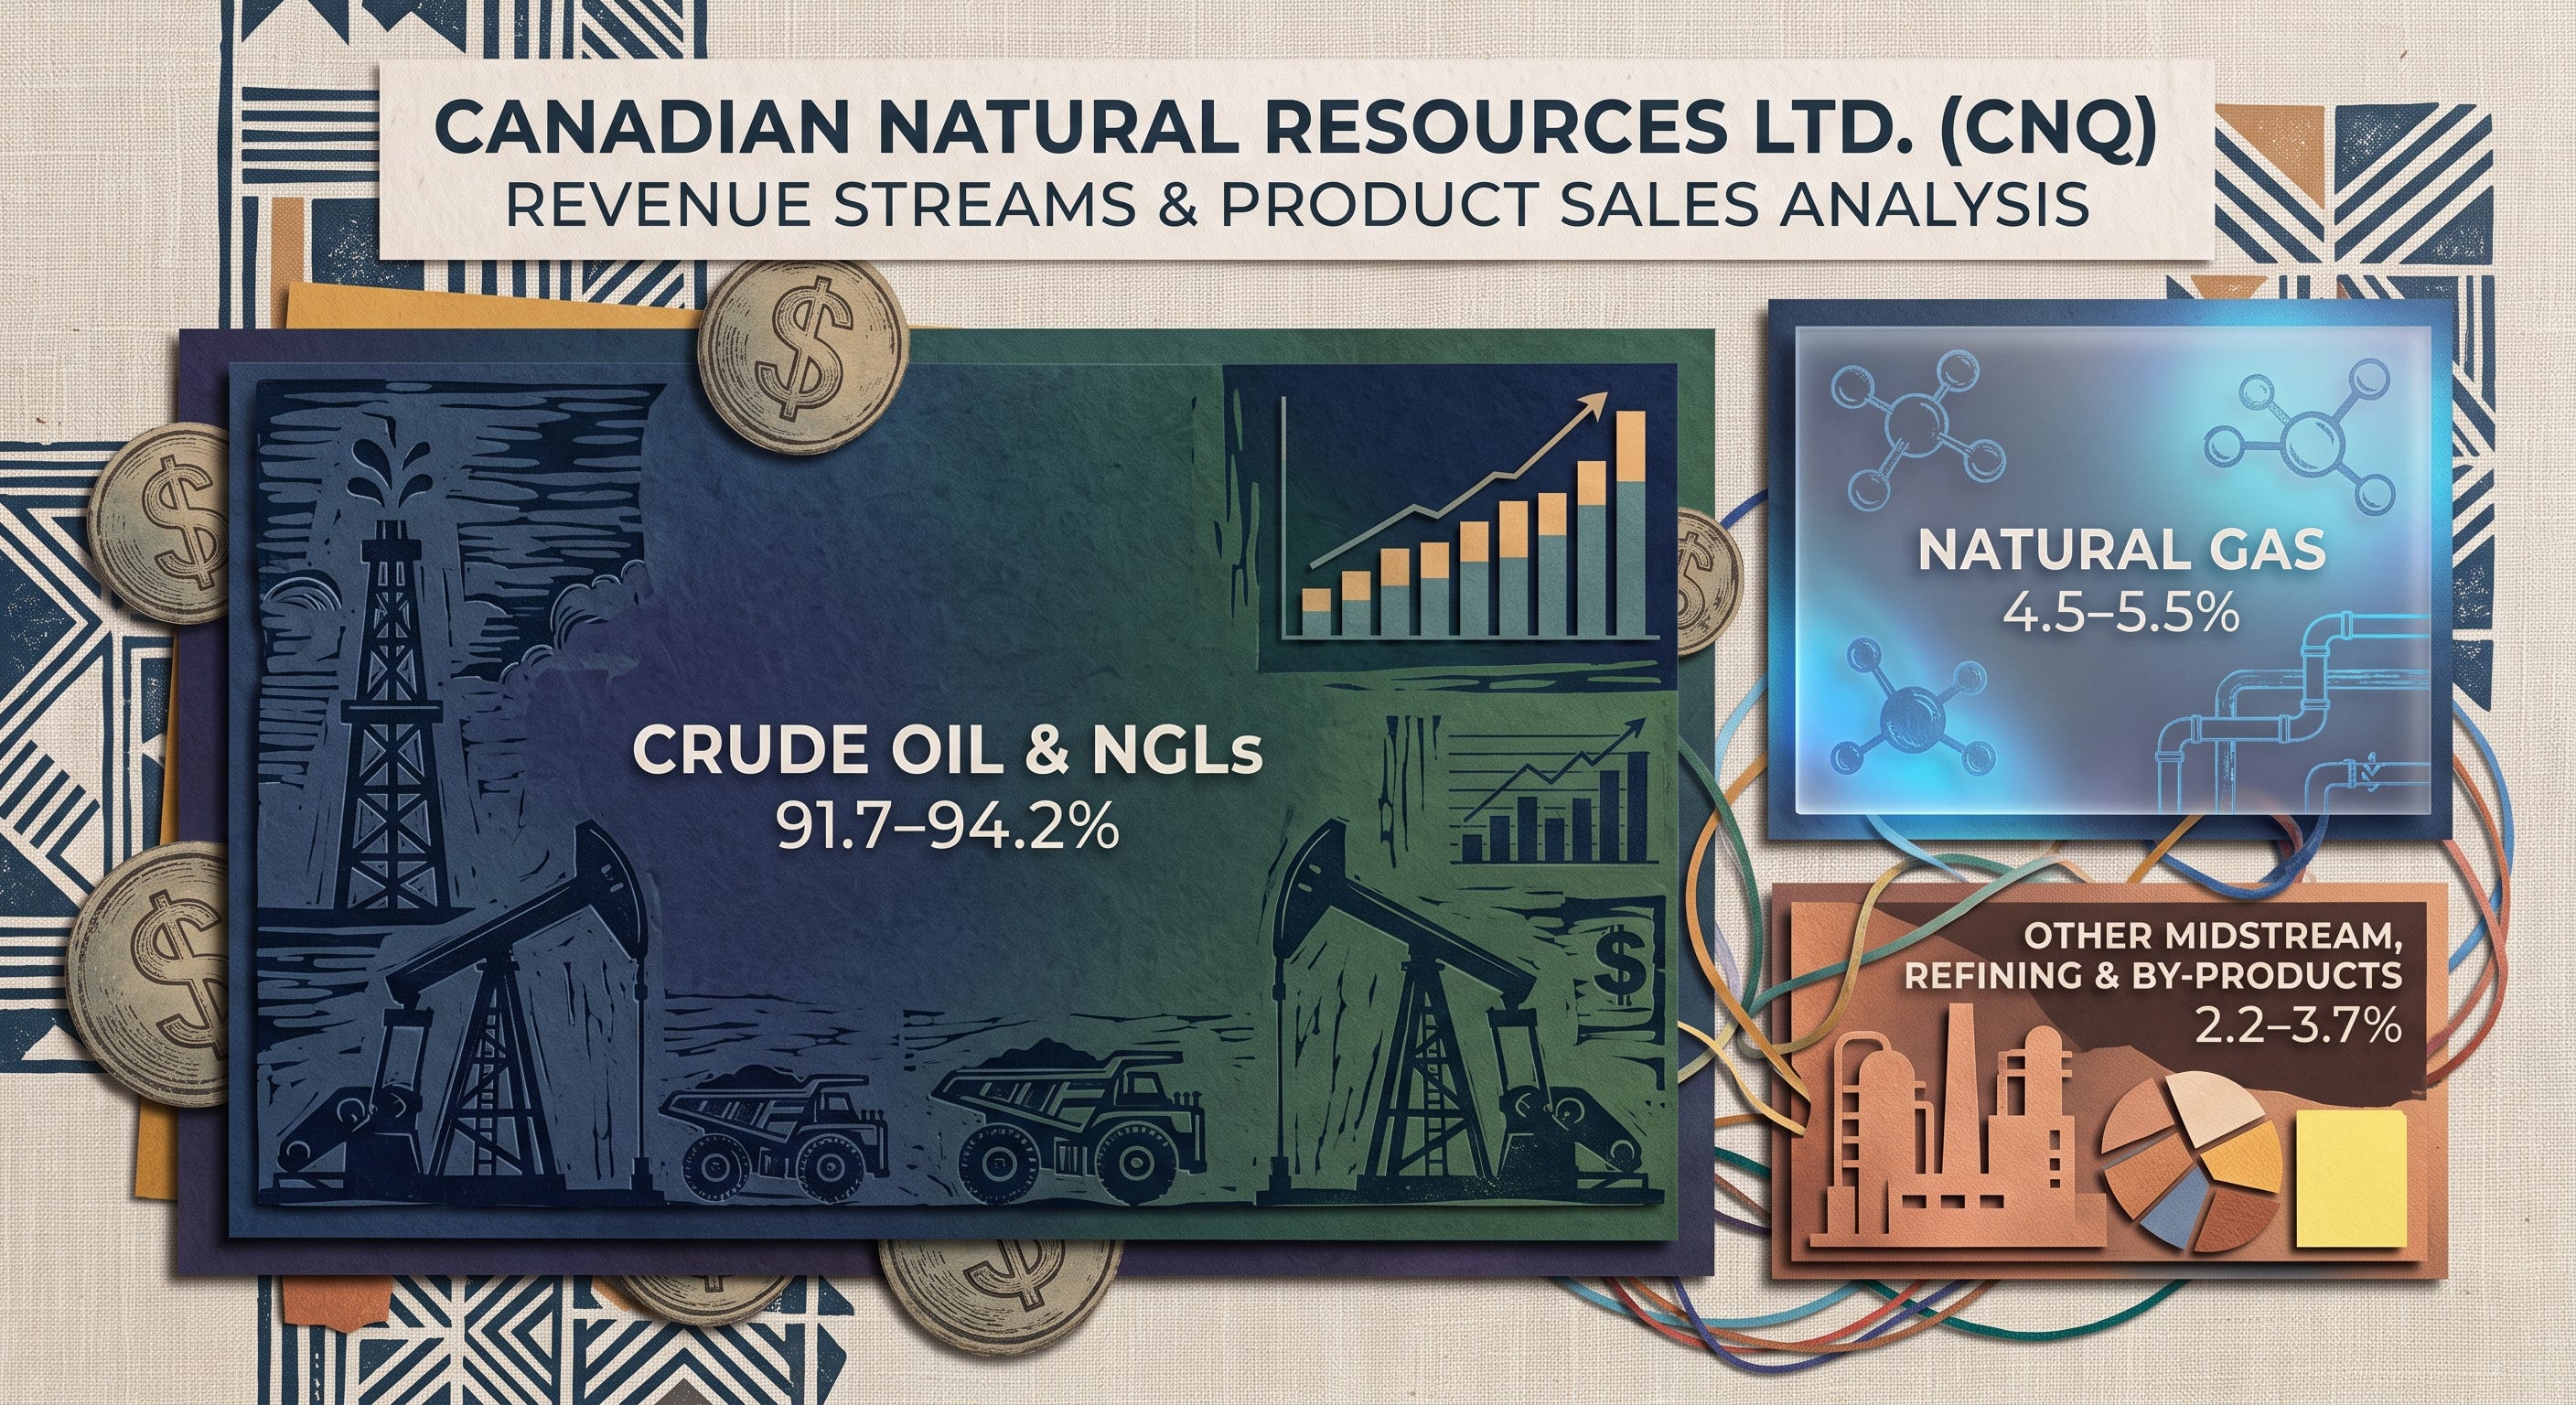
Canadian Natural Resources Ltd. (CNQ) is a senior independent energy company engaged in the acquisition, exploration, development, production, marketing, and sale of crude oil, natural gas, and natural gas liquids (NGLs). The company’s premium asset portfolio spans Western Canada, the North Sea, and Offshore Africa.
CNQ’s revenue is generated primarily from Crude Oil & NGLs, Natural Gas, and Other Midstream, Refining, and By-product (Sulphur) Activities. This report provides a detailed breakdown of these revenue streams based on the company’s latest financial filings up to the second quarter of 2026 (ended June 30, 2026).
1. Consolidated Product Sales by Product Type (Product-Type Perspective)
This is the most direct representation of CNQ’s raw product sales before the deduction of royalties.
Product Sales Breakdown (2024 – H1 2026)
The table below shows the distribution of CNQ’s product sales across its three main commodity types for the first half of 2026 (H1 2026), full-year 2025 (FY 2025), and full-year 2024 (FY 2024):
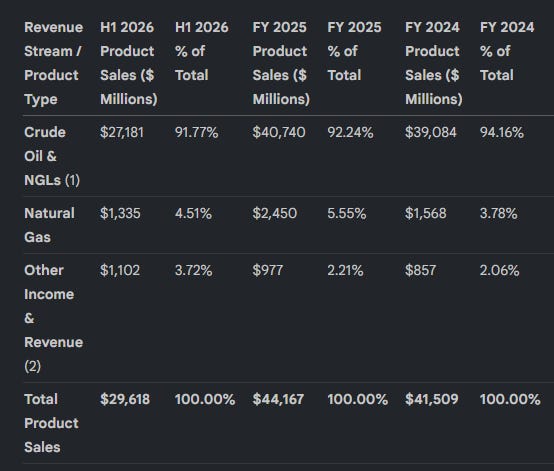
(1) Crude Oil & NGLs includes Synthetic Crude Oil (SCO), light/medium crude oil, primary heavy crude oil, Pelican Lake heavy crude oil, thermal bitumen, and Midstream pipeline product sales.
(2) Other Income & Revenue includes refined product sales from the North West Redwater (NWR) Refinery, sulphur sales, and other processing and third-party revenues.
Key Trends & Observations:
Extreme Liquids Weighting: Crude Oil and NGLs represent the vast majority of CNQ’s product sales, consistently hovering between 91.7% and 94.2% of total revenue [41, 138]. Within this category, high-value Synthetic Crude Oil (SCO) produced at the Horizon and Albian oil sands mines represents the dominant premium asset, capturing strong pricing and WTI premiums (averaging a US$8.37/bbl premium in Q2 2026).
Volatile Gas Contribution: Natural gas sales fluctuated from 3.78% of total product sales in 2024 to 5.55% in 2025, and stood at 4.51% in H1 2026, primarily driven by extreme price volatility (e.g., AECO gas benchmark prices fluctuating from C$1.92/GJ in early 2025 to C$2.36/GJ in early 2026).
Other Income Surge: Other income and revenue surged to $1,102 million (3.72%) in the first half of 2026, supported by strong sulphur pricing (which generated $450 million in net revenue for H1 2026) and increased refined product sales from NWR.
Gross product sales only tell part of the story. To uncover the actual top-line figures driving the income statement, we must strip out government royalties and isolate the underlying asset-level drivers.
Upgrade your subscription to The Global Gambit to unlock the rest of this analysis. Premium members gain immediate access to:
The After-Royalty Reality: The true segmented revenue figures and royalty rates essential for precision financial modeling.
Asset-Level Dynamics: A deep dive into the high-margin Synthetic Crude Oil (SCO) engines operating at the Horizon and Albian mines.
Strategic Cost-Shielding: How CNQ leverages internal natural gas consumption and fully owned midstream infrastructure to insulate its balance sheet from market volatility.