
LOGIC & LEVERAGE | Report No: 001 | Date: 01 July, 2026
A Monthly Publication of The Global Gambit

LOGIC & LEVERAGE REPORT
Table of Contents
1. Executive Summary: Key Topics & Market Radar
1.1 The Macro Narrative
1.2 Asset Class Spotlight
1.3 The Smart Money Signal
1.4 Featured Institutional Conviction Picks
2. Macro & Microeconomics: The Great Capital Migration
2.1 Structural Metamorphosis of Global Liquidity
2.2 The Commercial Real Estate Liquidity Spiral
2.3 Demographics and Insurance Capital Offloading
2.4 The Inflation Reduction Act “Pill Penalty”
3. Cross-Asset Performance & Relative Valuation Matrices
3.1 Global Valuation Extremes
3.2 Discounted Frontier Growth and Regional Monopolies
4. Friction & Geopolitical Supply Realignment in Commodities
4.1 The Beneficiation Supercycle: Mineral Resource Nationalism
4.2 Downstream Energy Squeezes and Sovereign Precious Metals Accumulation
5. Institutional Capital Allocations & Insider Flows
5.1 Strategic Macro Allocations: Inflows versus Outflows
5.2 Sovereign Alpha Risk-Adjusted Jurisdictions
5.3 Registry Concentration and Anti-Activist Insulation
5.4 Corporate Insider Cluster-Buying and Distribution Patterns
6. Sovereign Real Estate Matrices & Micro-Velocity Squeezes
6.1 Canadian Regional Divergence: Vancouver versus Calgary
6.2 United States Sun Belt Dynamics
6.3 Turkish Property Market Reconfiguration
6.4 United Kingdom and Southern European Divergence
6.5 Spanish Real Estate Pivot and REIT Optimization
6.6 Republic of Georgia Stabilization
7. High-Conviction Equity Underwriting & Scenario Models
7.1 ASA International Group PLC (LSE: ASAI) Deep Dive
7.2 The Bank of Nova Scotia (TSX/NYSE: BNS) Deep Dive
7.3 K-Bro Linen Inc. (TSX: KBL) Deep Dive
8. Institutional Disclosures & Compliance Notices
1. Executive Summary: Key Topics & Market Radar
1.1 The Macro Narrative
The global financial system is undergoing a structural reallocation of capital, driven by restrictive monetary policy, secular inflation, and state-sponsored industrial realignment. Institutional liquidity is systematically exiting traditional blind spots to anchor in resilient, highly defensive, cash-generative assets. This structural rotation is characterized by three overarching secular shifts:
The Great Migration: Massive capital flight is exiting the macroeconomic opacity of China and the debt-laden obsolescence of commercial real estate. This capital is rotating directly into U.S. industrial mega-projects and sovereign-protected physical infrastructure.
The Private Credit Surge: Traditional fixed-income duration is being replaced by bespoke private credit vehicles. However, systemic liquidity mismatches and underlying leverage loops are flashing critical red signals across non-bank lending channels.
The Longevity Shift: An unprecedented demographic wave (”Peak 65”) is permanently altering the life insurance business model from mortality risk management to longevity product distribution. This structural shift is generating a massive influx of highly predictable, sticky capital seeking spread-capture optimization.
1.2 Asset Class Spotlight
Refining sector downstream complex operations are generating historic cash windfalls. Precision geopolitical disruptions and Ukrainian drone strikes targeting Russian hydrocrackers have severed historical crude-to-refined product relationships. This disruption has artificially compressed the global refined product supply, widening crack spreads and transferring billions in economic rent directly to complex Western downstream refiners equipped to process heavy crudes under premium price regimes.
1.3 The Smart Money Signal
Corporate insider cluster-buying is signaling deep, fundamental conviction in localized infrastructure and defensive real assets. The strategy desk has identified aggressive insider accumulation in Canadian energy, where SEDI filings show senior executives reinvesting downstream refining margin windfalls into common stock, and in Spanish Promotoras, where developer management teams are proactively front-running institutional Build-to-Rent (BTR) capital allocations.
1.4 Featured Institutional Conviction Picks
Thesis ASAI (LSE)330 GBX
Frontier Microfinance Utilities
Heavily mispriced deposit-taking institution trading at 4.4x P/E with a clean audit and 43.8% ROAE.
BNS (TSX/NYSE)CAD $125.00
Cross-Border Banking Corridor
Strategic commercial corridor play utilizing a surgical FDIC charter acquisition to widen margins.
KBL (TSX)CAD $48.00
Monopolistic Industrial Sanitation
Monopolistic healthcare utility with high-barrier multi-decade contracts and a 22-year dividend track record.
2. Macro & Microeconomics: The Great Capital Migration
2.1 Structural Metamorphosis of Global Liquidity
A meticulous evaluation of recent 10-Q and SEDAR+ MD&A filings reveals an acute divergence between headline equity market index levels and structural macroeconomic risks. The global financial architecture has exited a decade defined by passive globalization and zero-interest-rate policies (ZIRP), entering a structural regime of restrictive cost of capital, localized inflation, and state-sponsored industrial warfare.
The most violent cross-border capital migration of the current decade is unfolding as capital exits the People’s Republic of China. This capital flight is not merely a cyclical outflow but a structural evacuation of private wealth seeking safety from geopolitical friction and regulatory interventions.
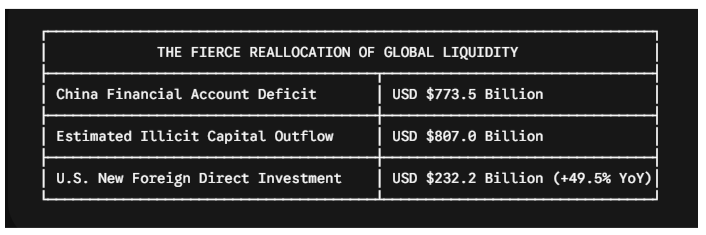
Table 2.1: Macro Liquidity Shifts: China Capital Outflows vs. U.S. FDI Inflows
To bypass Beijing’s strict USD $50,000 annual foreign exchange limitation, domestic entrepreneurs are deploying highly decentralized “smurfing” networks. This capital is flowing into jurisdictions offering structural economic moating, technological dominance, and robust legal protections.
By implementing targeted industrial policies—specifically the CHIPS and Science Act and the Inflation Reduction Act (IRA)—the United States has successfully attracted high-tech capital from Europe and Asia. This legislative pull drove new Foreign Direct Investment (FDI) expenditures in the U.S. to USD $232.2 billion, representing a 49.5% year-over-year increase and marking a permanent realignment of global supply chains.
2.2 The Commercial Real Estate Liquidity Spiral
The non-bank financial sector is facing structural pressure within the Commercial Real Estate (CRE) market. Approximately USD $2.9 trillion in CRE debt is scheduled to mature through 2027, with a critical concentration of USD $936 billion coming due in 2026.
Delinquency rates for commercial mortgage-backed securities (CMBS) tracking office properties have surged to 11.31%, surpassing the peaks observed during the 2008 Global Financial Crisis. This commercial delinquency spiral is forcing regional banks to shrink their loan books and aggressively tighten lending standards. This contraction creates a self-reinforcing liquidity vacuum that directly benefits flexible private credit allocators.
2.3 Demographics and Insurance Capital Offloading
Concurrently, the U.S. retirement wave is driving structural growth within the annuities market. With over 11,000 Americans turning 65 daily, the annuity market has scaled to an unprecedented USD $4 trillion.
This rapid expansion has created regulatory challenges for domestic life insurers. The influx of asset-liability matching obligations generates severe statutory “surplus strain,” limiting the capital available for distribution.
To optimize their balance sheets, primary insurers are offloading this surplus strain to third-party offshore reinsurers. This structural movement frees up trapped capital and allows insurers to widen their net interest margin capture in a normalized, non-ZIRP yield environment.
We will cover the insurance industry in greater detail in the August report, which will feature individual stock selections within both the casualty insurance and life insurance sectors.
2.4 The Inflation Reduction Act “Pill Penalty”
Within the pharmaceutical and healthcare sectors, the Inflation Reduction Act has altered the economics of drug development. The legislation subjects traditional small-molecule oral drugs to Medicare price negotiations just 9 years post-launch, while granting complex large-molecule biologics a 13-year exemption window.
This regulatory disparity has degraded the Net Present Value (NPV) profile of small-molecule oral medications. The result is a 70% drop in early-stage venture funding for small-molecule therapeutic pipelines.
This policy shift is forcing a systemic capital rotation toward complex biologics and large-molecule development, altering the competitive dynamics of the global life sciences sector.
3. Cross-Asset Performance & Relative Valuation Matrices
3.1 Global Valuation Extremes
The divergence in global asset valuations highlights the current structural split in equity markets. The U.S. S&P 500 information technology sector continues to command an historically high valuation premium, driven by capital expenditure cycles in artificial intelligence infrastructure.
However, these capital-intensive gains are masking underlying weakness in defensive, rate-sensitive domestic sectors. For example, the U.S. healthcare sector is enduring a sharp cyclical earnings trough, with projected 2026 EPS growth compressed to 2.5%.
3.2 Discounted Frontier Growth and Regional Monopolies
Outside the United States, significant valuation discounts exist within Asian semiconductor hardware ecosystems and localized Gulf Cooperation Council (GCC) infrastructure. Markets such as South Korea and Taiwan are outperforming Western benchmarks on pure earnings momentum.
Concurrently, GCC jurisdictions offer resilient dividend yields secured by sovereign-backed monopolies. These structures generate stable free cash flow yields that are insulated from broader global macroeconomic and interest rate volatility.
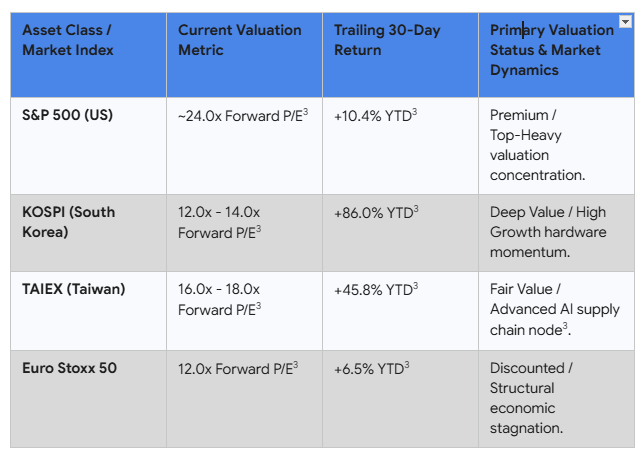
Table 3.2: Comparative Valuation Metrics and YTD Performance Across Global Indices
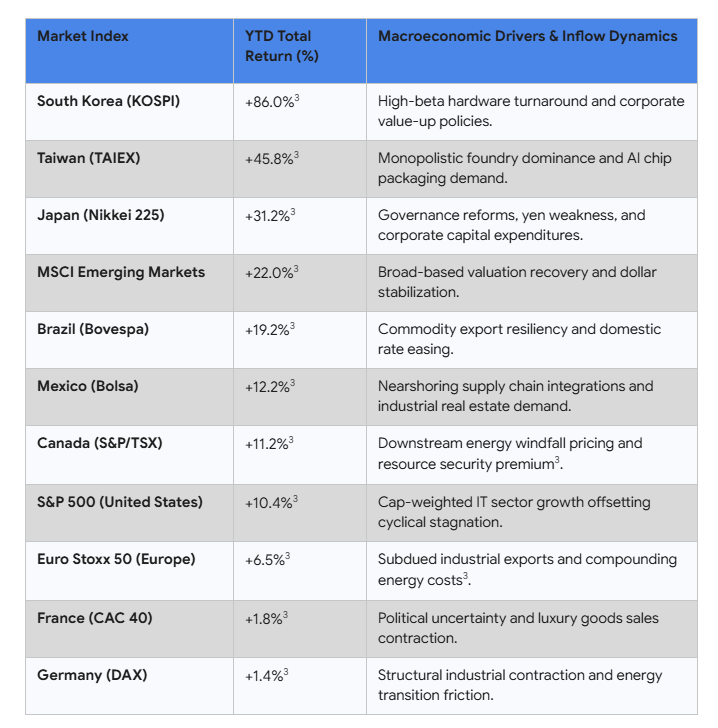
Table 3.3: Global Index Returns and Primary Macroeconomic Performance Drivers
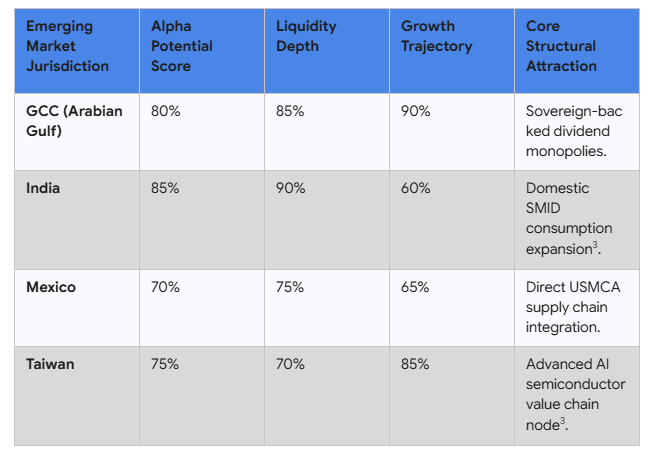
Table 3.4: Emerging Market Framework: Alpha Potential, Liquidity, and Structural Catalysts
4. Friction & Geopolitical Supply Realignment in Commodities
4.1 The Beneficiation Supercycle: Mineral Resource Nationalism
African mining jurisdictions are systematically restructuring their relationships with foreign resource operators. The historical paradigm where foreign miners extracted raw ore under low-single-digit royalties is ending.
Sovereign states are enacting strict domestic value-add mandates, or beneficiation requirements, alongside demanding larger state equity stakes in major deposits. This structural shift is altering the global supply economics of precious and industrial metals:
Guinea: The sovereign administration has enacted a strict ban on the export of raw, unrefined gold. This policy mandates that all gold mined domestically must undergo downstream processing and refining at a newly constructed state-partnered facility in Conakry.
Burkina Faso: The state has renegotiated terms with international gold developers, aggressively hiking its free-carried equity stake in the Kiaka gold project from 15% to 40%.
Mali: The government has enforced its 2026 Mining Code, structurally shifting the legal framework to allow domestic state and private entities to acquire control of up to 35% of existing mining operations.
4.2 Downstream Energy Squeezes and Sovereign Precious Metals Accumulation
The global energy complex is experiencing supply disruptions triggered by Ukrainian drone strikes on Russian secondary refining infrastructure, specifically high-conversion hydrocrackers. By forcing over 1.2 million barrels per day (bpd) of Russian secondary processing capacity offline, this campaign has generated a structural supply deficit in middle distillates, particularly diesel and jet fuel.
The primary beneficiaries of this structural squeeze are complex Western downstream refiners designed to process heavier crudes into light products under premium refining margin regimes. Refiners such as Valero Energy (NYSE: VLO) and Marathon Petroleum (NYSE: MPC) are generating substantial free cash flow from this artificial widening of global crack spreads.
Concurrently, emerging-market central banks are accelerating their physical gold accumulation. These institutions purchased 863 tonnes of physical gold in 2025.
This trend represents a non-custodial, structural hedge against the weaponization of G7 clearinghouses and the risk of reserve freezes. This de-dollarization flow is led by Poland (+102 tonnes), Kazakhstan (+57 tonnes), and China (+27 tonnes).
Unlock the Actionable Capital Ledger
Our global macro outlook points to structural dislocations across mispriced assets. Below this paywall, the strategy desk bypasses public index noise to deliver institutional execution data, granular cash flow modeling, and proprietary tracking fields. Paid subscribers receive immediate access to:
The Insider Signal: A full forensic breakdown of corporate cluster-buying trends identified via SEDI and Form 4 regulatory filings.
The Real Estate Matrix: Detailed ROI, net cap-rate, and Days-on-Market (DoM) structural models across global development corridors.
The Conviction Playbooks: Three institutional-grade equity deep dives featuring comprehensive moat assessments, intrinsic value ranges, and detailed debt-maturity schedules.
5. Institutional Capital Allocations & Insider Flows
5.1 Strategic Macro Allocations: Inflows versus Outflows
Institutional risk appetite has pivoted away from general technology exposure toward physical infrastructure, defensive real assets, and localized alpha generation. Capital allocators are systematically reducing duration exposure and lowering allocations to private credit as yields compress and default rates rise in lower-tier tranches.
Concurrently, Middle Eastern Sovereign Wealth Funds (SWFs) are recycling capital into global private markets, domestic infrastructure, and Asian equities. These entities now control approximately 40% of the aggregate assets of the world’s ten largest SWFs, on track to reach a projected USD $30 trillion in total AUM by 2035.
                     [CAPITAL ROTATION MAP - 2026]

      OUTFLOWS                                              INFLOWS
 ┌──────────────────────┐                             ┌──────────────────────┐
 │ Speculative Software │ ───►  AI Compute Hardware  ───►│ Datacenters & Power  │
 ├──────────────────────┤                             ├──────────────────────┤
 │  Traditional Bonds   │ ───►  Sovereign De-risk    ───►│ Physical Commodities │
 ├──────────────────────┤                             ├──────────────────────┤
 │ Private Credit Lower │ ───►   Direct Allocation   ───►│ Institutional OPRE   │
 └──────────────────────┘                             └──────────────────────┘
5.2 Sovereign Alpha Risk-Adjusted Jurisdictions
Sovereign wealth funds are increasingly utilizing direct and co-investment models to bypass standard General Partner (GP) fees. These direct allocations now constitute 50% to 60% of their private market deployments. The strategy desk tracks these targeted allocations across several key jurisdictions:
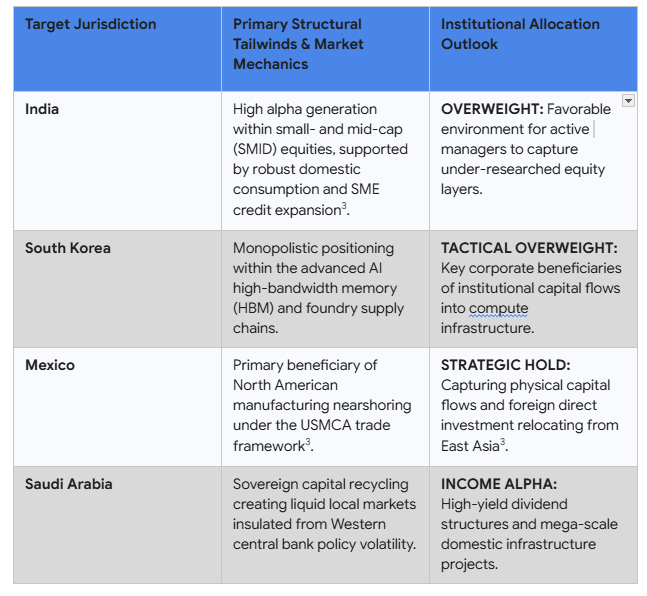
Table 5.2: Institutional Allocation Outlook and Structural Tailwinds by Target Jurisdiction
Fundamental Drivers in 2026
Localization and Supply Chain Security: GCC nations are aggressively leveraging their capital to force technology and manufacturing transfers. They are no longer simply writing checks to foreign firms; they require joint ventures that build local ecosystems (e.g., PIF’s recent structural alignment with Lenovo for advanced electronics manufacturing).
The AI and Compute Buildout: Recognizing that AI’s bottleneck is physical infrastructure, SWFs are aggressively funding the hardware layer. This includes domestic data centers, the heavy power generation required to run them, and strategic global partnerships (such as the PIF-backed USD 5 billion AWS “AI Zone”).
Disintermediation of General Partners (GPs): Allocations to private markets now constitute roughly 30% of their total AUM. To avoid standard GP fee drag and maintain strategic control, direct and co-investments now account for 50% to 60% of their private market deployments.
5.3 Registry Concentration and Anti-Activist Insulation
A forensic analysis of Major Shareholding Notifications (LSE TR-1 and Form 13D/G filings) reveals concentrated registry structures across our core conviction holdings. This structural concentration insulates corporate management teams from short-side proxy battles and activist disruptions:
ASA International Group PLC (LSE: ASAI): Three long-only entities control the institutional float. Conifer Management holds an approximate 19.08% stake, Phoenician Capital holds 10.10%, and JPMorgan Chase controls 4.98% of the voting rights. Co-founder and Deputy Chairman Dirk Brouwer exercises absolute voting control over 46.0% of the common shares outstanding via Creative Management & Investment Holding Co. (CMIMC).
K-Bro Linen Inc. (TSX: KBL): The institutional float is closely held by yield-oriented domestic asset managers. RBC Global Asset Management controls an absolute block of 8.26% (1,065,564 shares), insulating the company’s long-term utility-style strategy from short-term market volatility.
5.4 Corporate Insider Cluster-Buying and Distribution Patterns
A quantitative contrast exists between the insider trading profiles of our core holdings. While key executives at ASA International continue to purchase shares in the open market, mid-level operational managers at K-Bro Linen have taken advantage of recent share price appreciation to execute programmatic liquidity events.
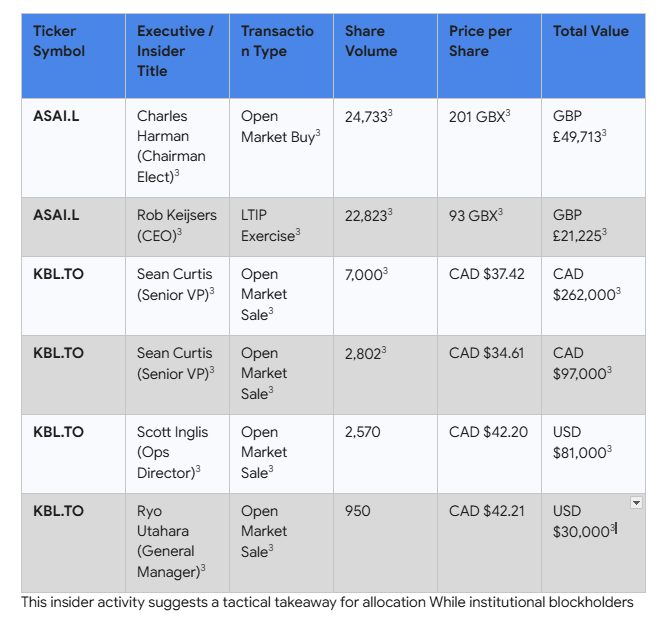
Table 5.4: Recent Insider Transactions and Executive Equity Activity
This insider activity suggests a tactical takeaway for allocators. While institutional block holders remain committed to KBL’s long-term utility moat, the operational management layer indicates that near-term valuation appreciation has been largely realized, making BNS and ASAI more attractive candidates for near-term capital deployment.
6. Sovereign Real Estate Matrices & Micro-Velocity Squeezes
6.1 Canadian Regional Divergence: Vancouver versus Calgary
The Canadian residential real estate market is defined by polarization between its major western hubs, driven by opposing regulatory frameworks and macroeconomic tailwinds.
In Vancouver, capital deployment faces structural headwinds. Speculative activity is disincentivized by a combination of the 20% Foreign Buyers Tax, the BC Speculation and Vacancy Tax (up to 2% of assessed value), and a 3% municipal Empty Homes Tax.
Speculative transactions, such as pre-sale flipping, are further restricted by the federal capital gains inclusion rate hike to 66.67% on corporate gains and individual profits exceeding CAD $250,000. Additionally, historically high inflows of mainland Chinese capital have declined due to Canada’s foreign buyer ban (extended through 2027) and domestic property-sector wealth contraction in China. Consequently, transaction volumes have compressed, and active listings have stagnated.
In Calgary, real estate activity is supported by different dynamics. Calgary has transitioned from a cyclical low into a demand-driven expansion, supported by disciplined energy-sector pricing and a relative affordability advantage.
This population growth has absorbed existing inventory, with active supply falling from 5 months in 2020 to under 1.5 months in 2026. Although benchmark pricing has surged past CAD $600,000 (up from CAD $410,000 in 2020), Calgary maintains an approximate 50% discount to Vancouver’s CAD $1.15M+ benchmark, preserving its yield appeal for residential capital.
At the national level, Canada continues to experience a structural housing supply deficit. The Canada Mortgage and Housing Corporation (CMHC) estimates that an additional 3.5 million units are required by 2030 to restore baseline affordability, while current national housing starts hover at an inadequate pace of 240,000 to 250,000 units annually.
For institutional allocators, Vancouver represents a complex environment requiring specialized density rezoning expertise, whereas Calgary presents a more favorable risk-adjusted yield profile supported by a benign tax framework and demographic growth.
6.2 United States Sun Belt Dynamics
The U.S. residential real estate thesis is focused on capital migration and structural inflation hedging rather than simple price appreciation. Capital continues to relocate from high-tax jurisdictions (e.g., California, New York) into Sun Belt states (Texas, Florida, the Carolinas, Tennessee).
However, these markets face headwinds from “higher-for-longer” interest rates and rising property insurance premiums, which challenge underwriting assumptions.
Under these conditions, a long-term fixed-rate mortgage can function as a structural hedge against currency debasement. In an environment of persistent inflation driven by deglobalization and fiscal expansion, the 30-year fixed mortgage serves as a subsidized, leveraged short position against the U.S. dollar:
Liability Immunization: Borrowers lock in the nominal cost of capital for 30 years, removing interest rate risk.
Asset Reflation: Underlying property values and rental income streams tend to scale with nominal inflation.
Debt Arbitrage: The real value of the mortgage liability systematically declines as principal is repaid using depreciated future currency.
A case study of San Antonio, Texas, illustrates the importance of analyzing real versus nominal yields under high carrying costs. While nominal asset prices have stabilized, achieving positive real returns is challenging.
Because Texas lacks a state income tax, municipalities levy property taxes of 2.5% to 3.0% annually. Combined with rising climate-related insurance premiums, this fixed operational opex drag can reach 3.5% of asset value.
If nominal price appreciation runs at 4% while structural inflation sits at 5%, cash-rich unleveraged investments in average housing can lose real purchasing power. This carrying-cost environment has created a clear structural split in the market:
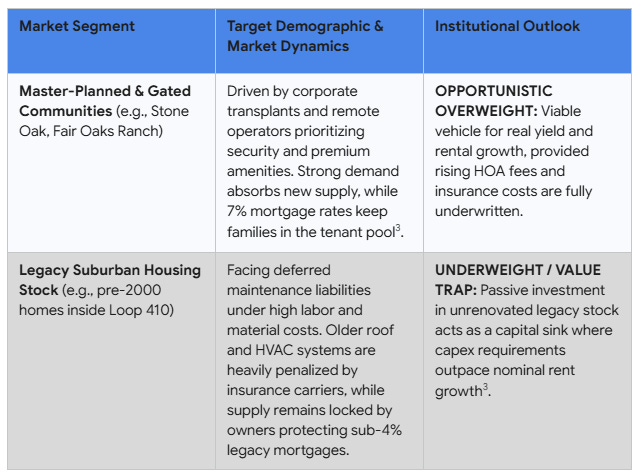
Table 6.2: Residential Real Estate Segment Analysis: Structural Dynamics and Allocation Outlook
6.3 Turkish Property Market Reconfiguration
The Turkish real estate market is transitioning from a hyperinflation-driven nominal bubble into a structured, real-term buyer’s market. Seeking to capitalize on Middle Eastern geopolitical tensions and subsequent wealth migration, Ankara is positioning Turkey as a regional wealth coordination center.
This pivot is supported by the ratification of Law No. 7582, which provides tax incentives for long-term capital retention, including a 20-year foreign income tax exemption, a reduced 1% inheritance tax, and up to 100% corporate tax deductions linked to the Istanbul Financial Center. Concurrently, anti-shadow economy oversight by MASAK on large cash transactions and property under-reporting has increased market transparency and normalized valuation data.
While nominal Lira-denominated prices continue to rise, CBRT and BIS data confirm that real, inflation-adjusted property prices have declined since their late-2022 peak. This correction has shifted negotiating leverage to cash-rich investors holding hard currency (USD/EUR), with typical sale-to-list ratios compressing to between 92% and 97%.
Although foreign purchases dipped 11.6% year-over-year in early 2026, total market liquidity remains stable, reaching a 2026 peak of 126,808 units in April. Regionally, the market is segmented:
Istanbul: Captures a 34.2% market share, functioning as the primary liquidity and citizenship-by-investment venue, yielding approximately 8.8% near major transport corridors.
Antalya: Commands a 12.7% market share, serving as the primary lifestyle and vacation rental destination with gross yields of 6.6%.
Secondary Markets (e.g., Adana, Konya): Offer higher localized rental yields exceeding 10.0%, but lack Istanbul’s liquidity depth and capital appreciation potential.
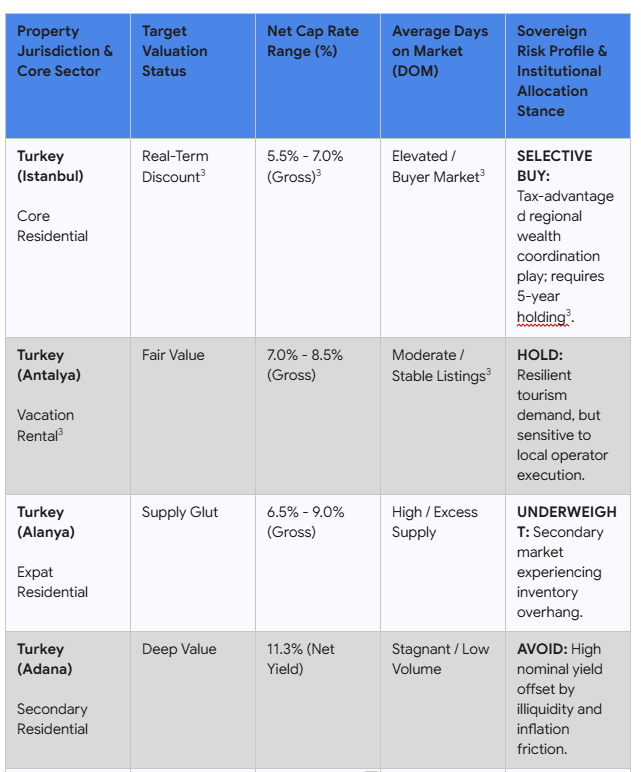
Table 6.3: Turkish Real Estate Submarket Framework: Cap Rates, Liquidity, and Sovereign Risk Profiles
From a structural analysis perspective, this market segment is best characterized as a vehicle for long-term wealth protection and yield generation rather than short-term trading. Speculative flipping is structurally disincentivized by a mandatory 3-year holding period for citizenship-linked acquisitions and capital gains taxes on properties sold under 5 years.
The data highlights a compelling case for new-build residential assets near transit hubs on the Asian side of Istanbul. These opportunities are driven by a 20-year foreign income tax exemption and the strategic benefit of extending the horizon past the 5-year capital gains window.
6.4 United Kingdom and Southern European Divergence
The UK property landscape is characterized by a divergence between a growth-constrained residential sector and a resilient premium commercial sector. With the Bank of England (BoE) base rate stabilizing at 3.75%, standard variable mortgage rates have settled near 6.49%.
While Q2 2026 mortgage approvals recovered 9% year-over-year, residential capital appreciation is limited by affordability constraints, shifting the residential sector’s focus toward yield generation. In Prime Central London (PCL), core postcodes sit 20% to 29% below their 2014 peaks, allowing cash-buyers to acquire luxury assets at average listing discounts of 17.1% in Mayfair.
In the commercial sector, the market is witnessing a “flight to quality”. Listed homebuilders (e.g., Taylor Wimpey, Barratt Redrow) are experiencing a margin squeeze from construction cost inflation and flat nominal home prices.
Conversely, prime commercial REITs are outperforming the broader market, up over 14% year-to-date. Operators such as British Land (LON: BLND) and Landsec (LON: LAND) report occupancies near 98%, with central London office demand driving like-for-like rental growth.
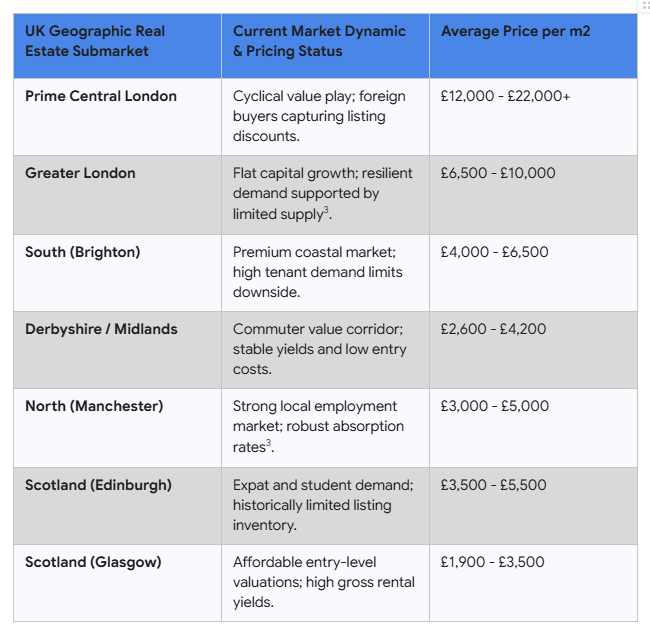
Table 6.4: UK Geographic Real Estate Submarkets: Pricing Status and Average Valuation Metrics
Smart money capital is rotating away from secondary offices and traditional retail to concentrate on Operational Real Estate (OPRE), including data centers, student accommodation (PBSA), and Build-to-Rent (BTR) pipelines.
On a relative-value basis, Southern Europe currently offers more compelling opportunities than the UK. In Q1 2026, Spain recorded a 93% year-over-year surge in institutional investment, reaching €6.3 billion. Institutional capital is front-running price appreciation in the Spanish “Living” sector (residential, BTR, and hospitality), where the Costa del Sol and Madrid offer higher net yields and lower operational overhead than the UK.
6.5 Spanish Real Estate Pivot and REIT Optimization
The Spanish development sector is shifting from traditional Build-to-Sell (BTS) models toward high-margin, asset-light Joint Ventures (JVs) and Build-to-Rent (BTR) platforms:
Neinor Homes, S.A. (BME: HOME): Valued at a market capitalization of approximately EUR 1.65 billion, Neinor is executing a co-investment framework alongside institutional capital partners such as Banco Santander. This model generates development management fees while reducing balance sheet risk and accelerating Return on Equity (ROE). This structural shift is supported by recent executive insider buying.
Aedas Homes, S.A. (BME: AEDAS): Valued at a market capitalization of EUR 1.02 billion, Aedas functions as an income vehicle with an expected dividend yield of 11.5%. The company utilizes institutional block sales to clear premium inventory across high-demand metropolitan areas, though long-term underwriting must monitor potential margin compression against domestic wage growth.
The public SOCIMI (REIT) market displays a clear division between legacy office assets and technology infrastructure:
Merlin Properties SOCIMI, S.A. (BME: MRL): Standing as a EUR 10.2 billion market leader, Merlin has evolved into an AI infrastructure operator in Southern Europe. Backed by a €950 million institutional capital raise, the company is deploying a data center pipeline across Madrid, Barcelona, and Bilbao, where asset terminal value is supported by long-term power purchase agreements (PPAs) rather than standard commercial leases.
Inmobiliaria Colonial, SOCIMI, S.A. (BME: COL): Valued at a market capitalization of EUR 3.44 billion, Colonial focuses on prime office space in Paris, Madrid, and Barcelona. Trading at a discount to Net Asset Value (NAV), recent insider buying indicates internal confidence in the portfolio’s 98% occupancy rate and premium pricing power, which contrasts with the broader global secondary office sector.
6.6 Republic of Georgia Stabilization
The Republic of Georgia’s real estate market has transitioned from the high growth of 2022-2023 into a structural stabilization phase. For institutional allocators, the market has evolved from a short-term capital appreciation play into an operational yield and tax-arbitrage opportunity.
Residential asking prices in Tbilisi have stabilized at a floor of USD $1,340 to $1,380 per square meter, while gross rental yields have compressed from their 12% peak down to 7.5% to 8.1%. Concurrently, Georgia’s emerging role as a transit hub connecting China and Central Asia to Europe via the “Middle Corridor” has increased demand for Class A and B logistics and warehousing space in corridors such as Lilo and Orkhevi (adjacent to Tbilisi Airport), where lease values command USD $400 to $800+ per square meter amid structural infrastructure bottlenecks.
On March 1, 2026, the Georgian government raised the investment threshold for short-term residency permits from USD $100,000 to $150,000. This policy has concentrated demand within premium residential developments in Tbilisi (e.g., Saburtalo, Vake) and branded residences in Batumi targeting international nomads.
For agricultural land investments, which offer development potential but face a constitutional prohibition on direct foreign ownership, institutional capital utilizes three main structures:
Long-Term Leases: Executing 49-year leases, a common structure in the Kakheti agricultural region.
Status Conversion: Proactively converting agricultural land designations to “non-agricultural” via the Ministry of Environmental Protection and Agriculture.
Sovereign Investment LLCs: Establishing a foreign-owned Georgian corporate entity backed by a government-approved economic investment plan.
Georgia remains a tax-efficient jurisdiction for international investors. Capital gains taxes are 0% if a residential property is held for more than 2 years (versus 5% if sold within 2 years).
Gross residential rental income is taxed at a flat rate of 5.0%, and annual property taxes are capped at 1% of assessed value. Furthermore, individuals are exempt from property tax if their Georgian-sourced household income is below 40,000 GEL (approximately USD $14,500), and foreign-sourced distributions remain non-taxable.
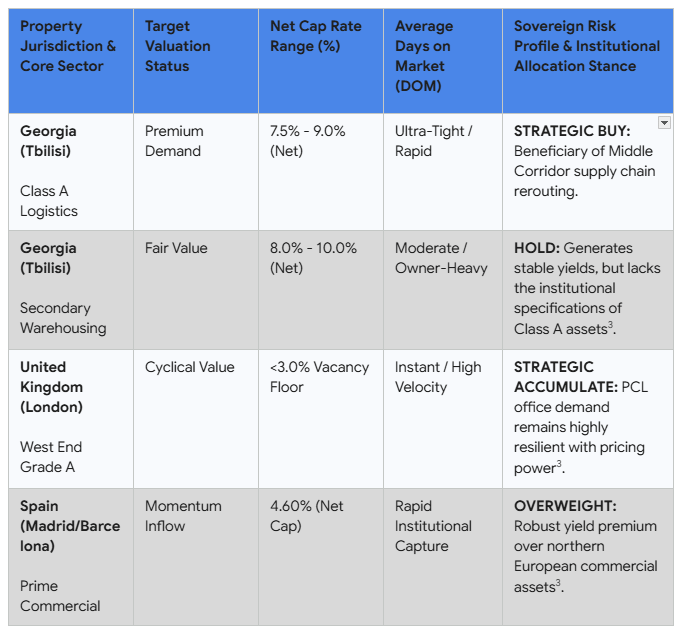
Table 6.6: International Commercial Property Segments: Cap Rates, Days on Market, and Allocation Stances
7. High-Conviction Equity Underwriting & Scenario Models
7.1 ASA International Group PLC (LSE: ASAI) Deep Dive
7.1.1 The Fundamental Thesis
ASA International represents a high-conviction variant perception where public markets are pricing a scalable, deposit-taking financial institution for terminal decay. Consensus market expectations remain anchor-biased to trailing financial cycles when localized foreign exchange volatility and a holding-company debt maturity wall forced external auditors to attach a “going concern” material uncertainty clause to the company’s disclosures.
For the complete deep-dive analysis on this position, see the full research article published on The Global Gambit Substack: 4.4x Earnings, 43.8% ROAE: The Mispriced Frontier Banking Turnaround.
Management has systematically addressed these risks over the past twenty-four months. This material uncertainty clause was formally removed in the FY 2025 Annual Report.
Management has reduced Net Debt at the holding company to USD $45.2 million, shifting liability risk to local operating subsidiaries in local currencies, while scaling client deposits by 52% year-over-year to USD $136.7 million. The equity trades at a trailing P/E multiple of 4.4x and a Price-to-Tangible Book Value (P/TBV) of 1.77x, relative to its verified 43.8% Return on Average Equity (ROAE).
                ASA INTERNATIONAL METRIC NORMALIZATION

    HISTORICAL RISK PROFILE (2023-2024)         RE-RATING CATALYSTS (2025-2026)
 ┌──────────────────────────────────────┐   ┌──────────────────────────────────────┐
 │ • Going Concern Clause Active        │──►│ • Going Concern Formally Removed     │
 │ • High Upstream Dividend Dependency  │──►│ • Deposit Base Scales +52% YoY       │
 │ • Holding Company FX Debt Overhang   │──►│ • Subsidiary Self-Funding Model      │
 └──────────────────────────────────────┘   └──────────────────────────────────────┘
7.1.2 The Moat & The Competition
The company’s operational durability is supported by the “ASA Model,” a high-touch microfinance framework that replaces traditional credit bureau infrastructure with village-level social collateral. By organizing low-income, female entrepreneurs into peer groups that cross-guarantee short-duration working capital loans (yielding an average gross return of 48.4%), ASAI reports a client retention rate of 80% and a consolidated Portfolio at Risk (PAR > 30) of 1.8% to 2.0%.
This localized peer-group enforcement mechanism helps insulate the loan portfolio from the credit volatility that impacts traditional commercial banks in emerging markets. Furthermore, a technology moat is expanding via the transition to the Temenos T24 core banking system. Completed across Pakistan, Ghana, and Tanzania, this migration reduces paper-based administration, doubling a single loan officer’s capacity from 300 to 600 clients and compressing the cost-to-income ratio by 460 basis points to 56.8%.
7.1.3 Balance Sheet Leverage & Scenario Modeling
A review of the liability architecture confirms that the risk of upstreaming dividends to cover hard-currency wholesale debt has been mitigated through deposit mobilization and subsidiary localization. Third-party interest-bearing debt at the operating subsidiary level of USD $412.7 million is matched to local currency assets.
Our 2-year forward Bayesian scenario model establishes the following return distribution, based on the expected value formula:
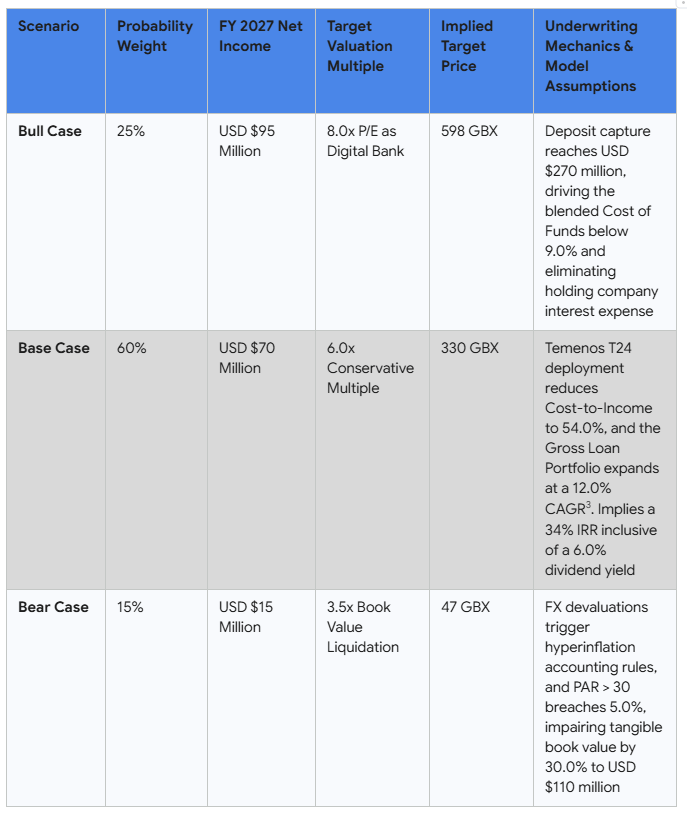
Table 7.1.3: Three-Scenario Intrinsic Valuation Model and FY 2027 Target Price Projections
7.1.4 Post-Publication Timeline Audit & Verification
Trailing Price Performance: The stock has established a technical accumulation base, trading within the 190 GBX to 205 GBX window, supported by a forward dividend yield floor of 5.5% based on the Board’s recommended USD $0.143 per share payout.
Interim Catalyst Check: In March 2026, management completed the sale of its underperforming asset, ASA India. By running down the Indian portfolio by 76% to a nominal USD $7.2 million and redeeming Non-Convertible Debentures (NCDs) for 1 INR, the parent company isolated its balance sheet from legacy Indian credit risk and recognized a USD $11.4 million accounting gain in Q1 2026.
Thesis Status: The core investment thesis remains intact, as the market’s implied 22% to 26% cost of equity discount rate does not reflect the improved operational profile verified by external auditors.
7.2 The Bank of Nova Scotia (TSX/NYSE: BNS) Deep Dive
7.2.1 The Fundamental Thesis
The Bank of Nova Scotia (Scotiabank) is executing a strategic pivot under CEO Scott Thomson, shifting international capital allocation away from Latin American emerging markets to focus on the North American commercial trade corridor. Facing a mature Canadian domestic retail market, BNS is deploying capital into U.S. commercial banking infrastructure to capture trade-finance flows.
For a complete strategic and financial breakdown of this transaction, see the full research article published on The Global Gambit Substack: Scotiabank (BNS) Acquires MapleMark Bank: M&A Valuation & Stock Impact.
The execution of a definitive agreement to acquire Dallas-based commercial lender MapleMark Bank is a low-risk, strategic tuck-in transaction. While the target’s asset base is a modest USD $1.01 billion, the market has treated this transaction as an immaterial corporate addition.
In reality, the acquisition is designed to secure an active Federal Deposit Insurance Corporation (FDIC) charter, providing Scotiabank’s Global Banking and Markets division with a regulated U.S. funding source.
7.2.2 The Moat & The Competition
Scotiabank is leveraging its balance sheet scale (CAD $1.5 trillion in total assets) to address a funding friction that impacts non-U.S. lenders competing in Mortgage Capital Markets. Standard commercial banking competitors often fund mortgage-backed security warehouse tranches via wholesale repurchase agreements (repo markets), which can compress net interest margins during monetary tightening cycles.
By importing MapleMark’s regulatory FDIC structure, Scotiabank can attract stable, low-cost commercial and retail deposits up to the USD $250,000 legal ceiling. These core deposits displace high-cost wholesale interbank liabilities on the trading desk, protecting the bank’s net interest margin (NIM) relative to domestic Canadian peers.
Furthermore, MapleMark operates a high-net-worth commercial banking model out of corporate nodes like Old Parkland in Dallas, providing Scotiabank Wealth Management with a customer base that is insulated from retail consumer credit exposure.
7.2.3 Balance Sheet Leverage & Scenario Modeling
Scotiabank reports a Tier 1 Risk-Based Capital Ratio of 14.537% and Non-Performing Assets restricted to a 0.24% to 0.43% band, indicating stable balance sheet health. Our structural M&A scenario valuation mechanics assume an implied purchase price of USD $200 million:
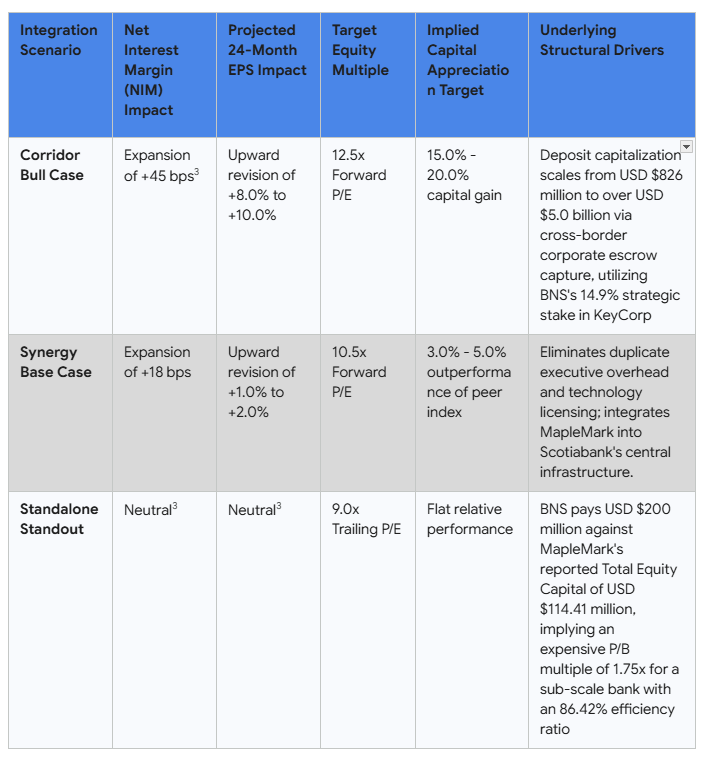
Table 7.2.3: Bank Integration Scenarios: Net Interest Margin (NIM) Impacts and Strategic Projections
7.2.4 Post-Publication Timeline Audit & Verification
Trailing Price Performance: The stock has traded in line with central bank rate expectations, maintaining its stable CAD $110.62 range on the Toronto Stock Exchange.
Interim Catalyst Check: Change-of-control filings submitted to state and federal banking regulators have entered the mandatory public comment period. Sell-side intelligence confirms that community advocacy groups are reviewing MapleMark’s historical Community Reinvestment Act (CRA) ratings, which had impacted previous merger attempts, such as the 2022 Oakwood Bancshares transaction.
Thesis Status: The thesis is progressing as expected, with the market pricing in the timeline required for Scotiabank to deploy a localized Community Benefit Plan to clear regulatory hurdles, supporting our near-term neutrality stance and long-term accumulation mandate.
7.3 K-Bro Linen Inc. (TSX: KBL) Deep Dive
7.3.1 The Fundamental Thesis
K-Bro Linen Inc. represents the financialization of a non-discretionary physical operation: industrial laundry services. Operating as a centralized continuous-batch textile management partner for healthcare authorities and hospitality chains, the company functions as a localized utility.
For an in-depth breakdown of the company’s operational footprint and competitive positioning, see the full research article published on The Global Gambit Substack: K-Bro Linen Inc. (TSX: KBL): Business Model Analysis.
The company manages the operational complexity of biohazardous textile sanitation and unionized labor forces for healthcare networks, billing clients on a contractually locked per-pound basis. The equity market prices the common shares at a standard services multiple, which does not fully reflect the company’s long-term exclusive municipal contracts.
7.3.2 The Moat & The Competition
The competitive architecture of K-Bro is split across two distinct geographic regions. Domestically, the company is the primary operator in Canada, running eleven automated processing facilities positioned near key transit corridors.
The Canadian market is protected by high capital barriers to entry and long-term exclusive municipal health contracts with extended horizons, such as Alberta contracts locked until July 31, 2032, and Saskatchewan contracts locked until June 1, 2031. A new market entrant would require significant capital to replicate this infrastructure without guaranteed initial volumes.
In the United Kingdom, where the market is a mature £1.6 billion sector characterized by fragmented competition (e.g., Elis SA, Johnson Service Group), K-Bro has executed a consolidation strategy. By integrating the legacy Fishers brand with the acquisitions of Shortridge (2024) and the £107.2 million (CAD $143.9 million) buyout of Stellar Mayan (2025), K-Bro has established a top-three national platform across Great Britain, serving hospitality operators and National Health Service (NHS) trusts.
7.3.3 Balance Sheet Leverage & Scenario Modeling
Despite its acquisition strategy, K-Bro maintains a conservative capital structure. As of Q1 2026, the company’s long-term debt stands at CAD $226.0 million, balanced by CAD $30.8 million in cash, resulting in Net Debt of CAD $204.4 million.
Against an annual Adjusted EBITDA of CAD $98.6 million, the Net Debt-to-EBITDA leverage multiple sits at 2.1x, supporting its 22-year sequential monthly dividend program (CAD $0.10 per share monthly / CAD $1.20 annualized).
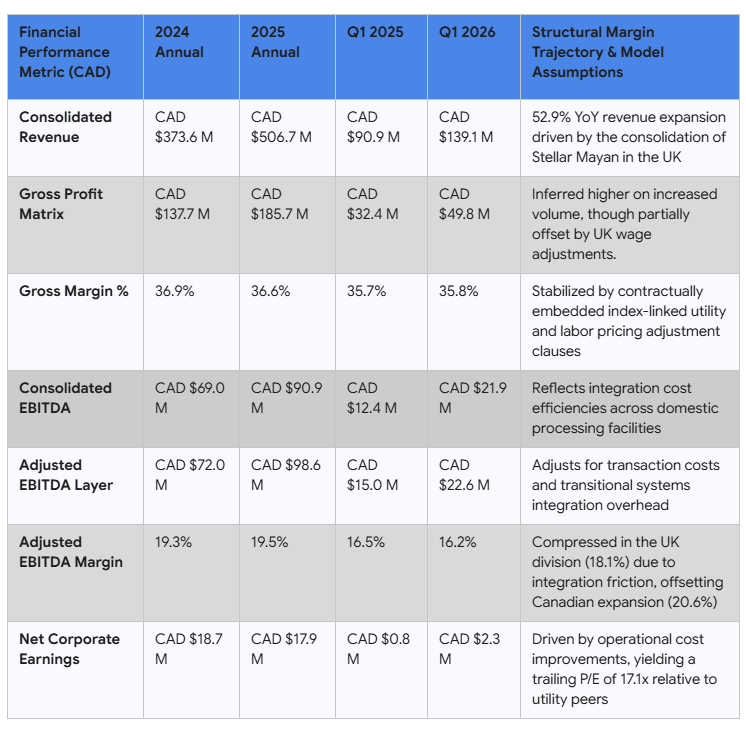
Table 7.3.3: Financial Performance Metrics and Structural Margin Trajectory (CAD)
The primary variable in our valuation model is the margin trajectory of the UK division. While the Canadian division expanded its Adjusted EBITDA margin to 20.6% due to labor efficiencies and the structural removal of the Canadian carbon tax, the UK division compressed to 18.1% due to Stellar Mayan integration costs.
If management extracts targeted synergies over the next 12 to 24 months, normalizing UK margins toward the 20.0% Canadian baseline, the consolidated cash flows support intrinsic value expansion above current CAD $39.51 levels.
7.3.4 Post-Publication Timeline Audit & Verification
Trailing Price Performance: The stock has demonstrated low-beta (0.49) accumulation characteristics, trading above its bought-deal equity offering floor of CAD $34.55, which raised CAD $75.6 million to fund the Stellar Mayan acquisition.
Interim Catalyst Check: Management has updated its capital spending guidance for fiscal 2026, elevating planned CapEx to a range of CAD $20.0 million to CAD $22.0 million. This deployment includes the allocation of GBP £5.0 million (CAD $9.3 million) in post-acquisition capital to install automated sorting and processing systems across the newly acquired UK facilities.
Thesis Status: The core investment thesis remains intact. The defensive healthcare segment now constitutes 60.9% of consolidated revenues, providing a stable revenue base that insulates the dividend program from broader macroeconomic volatility and energy input cost adjustments.
8. Institutional Disclosures & Compliance Notices
8.1 Analyst Certification
The primary analyst certifies that all views expressed in this research report accurately reflect personal views about the subject securities, macroeconomic sectors, and geographic jurisdictions. No part of the analyst’s compensation was, is, or will be directly or indirectly related to the specific recommendations or views contained herein. The publishing entity, its affiliates, and the authors may hold long or short positions in the securities discussed in this report.
8.2 General Disclaimer
This document has been prepared by the strategy desk for institutional, accredited, and professional asset allocators and is provided for informational and educational purposes only. It does not constitute a personal investment recommendation or take into account the particular investment objectives, risk tolerances, financial situations, or needs of individual investors.
The price and value of the investments referred to in this research and the income generated by them may fluctuate. Past performance is not a reliable indicator of future results, and a complete loss of original capital may occur. Foreign currency transactions carry risks, and fluctuations in exchange rates can adversely affect the value, price, or income of denominated investments.
8.3 Jurisdictional and Regulatory Compliance Notice
The analysis presented in this report is based on public regulatory disclosures, including SEC EDGAR filings in the United States and SEDAR+ or SEDI disclosures in Canada. All financial metrics, asset valuations, and modeling scenarios utilize local currencies as stated to prevent cross-border dual-listing discrepancies.
For Canadian capital markets, this content complies with the regulatory frameworks governing investment research distribution and financial market communications. All international real estate data is sourced from respective central banks (CBRT), the Bank for International Settlements (BIS), and primary institutional property registries.