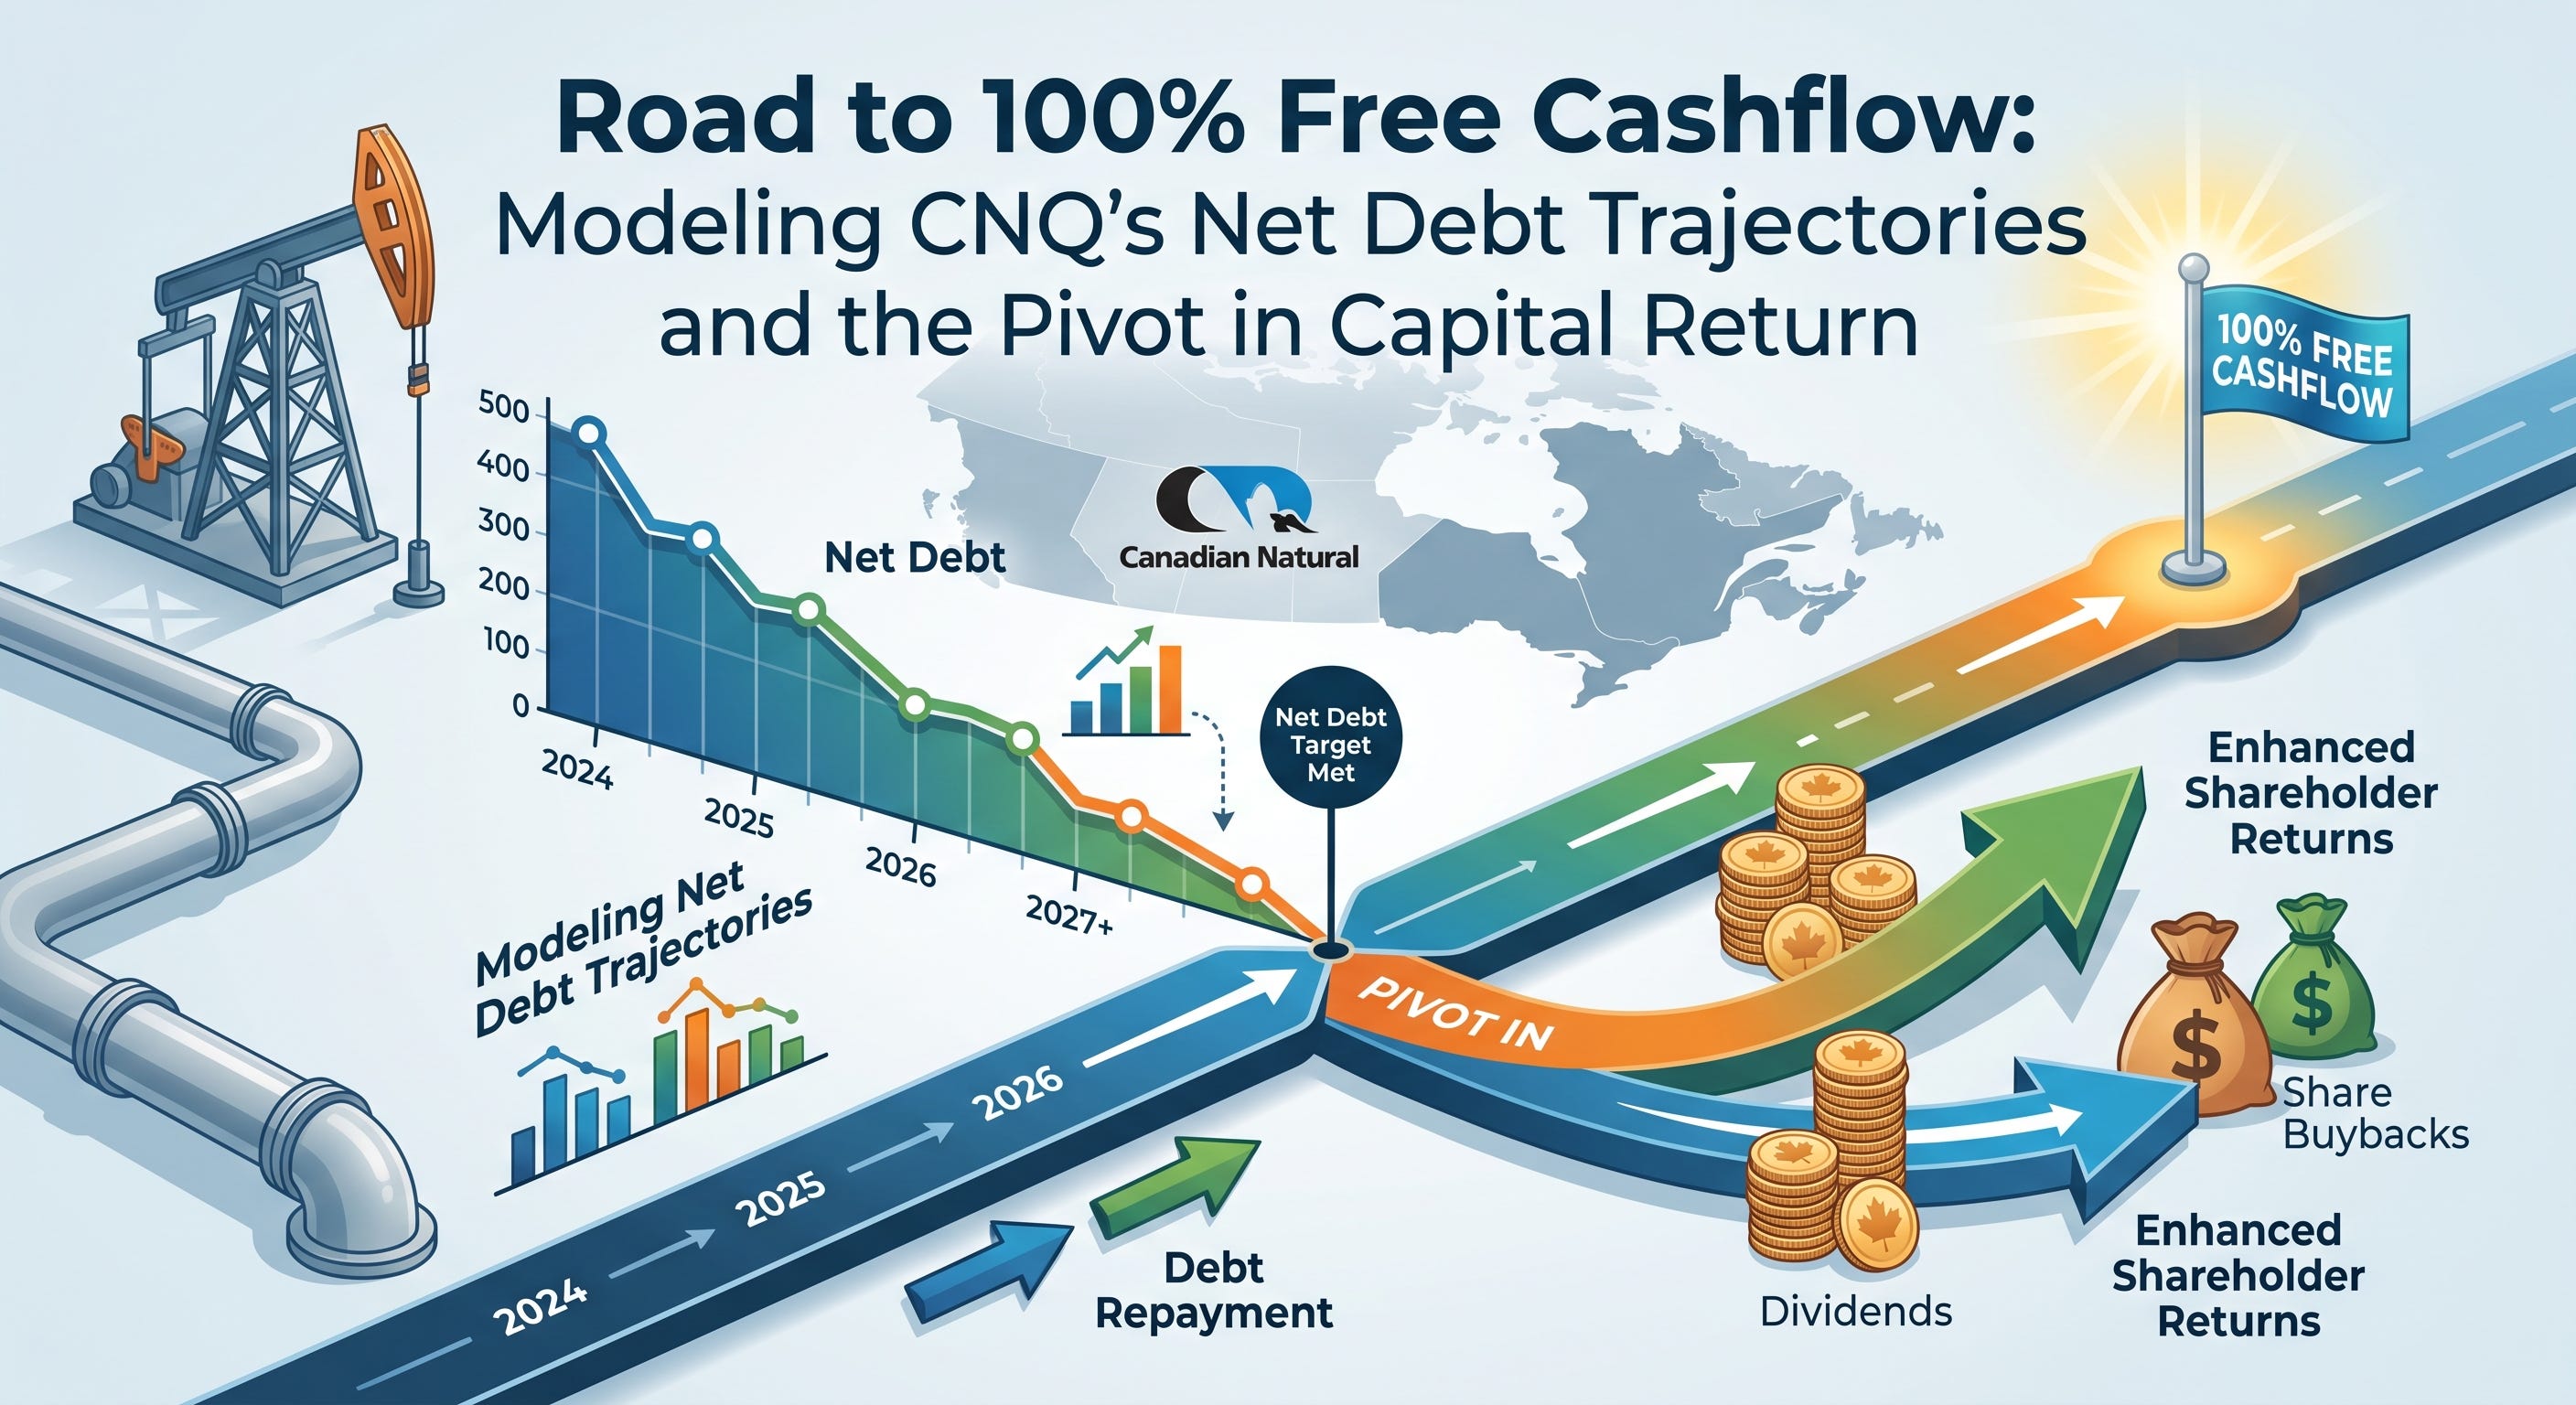
Road to 100% Free Cashflow: Modeling CNQ's Net Debt Trajectories and the Pivot in Capital Return
Accelerating Shareholder Value as Canadian Natural Resources Targets the $13 Billion Net Debt Milestone
Date: August 16, 2026
Exchanges: TSX / NYSE
Ticker Symbol: CNQ
Current Share Price: ~$63.80
The prices and financial figures in the article are in Canadian Dollars (CAD).
Disclaimer: This article contains forward-looking statements, financial modeling estimations, and theoretical share price calculations based on historical data and company projections. This does not constitute financial or investment advice.
Canadian Natural Resources Ltd. (CNQ) is rapidly approaching a highly anticipated financial milestone: reducing its net debt to $13.0 billion. Achieving this target will trigger a pivotal shift in the company's capital allocation strategy, increasing the free cash flow (FCF) returned directly to shareholders from 75% to a full 100%. Based on current modeling, this pivot will unlock significant value and materially alter the company's return yield.
The Debt Reduction Trajectory
As of the June 30, 2026 balance sheet, CNQ reported net debt of $14,526 million [cite: 1]. To bridge the remaining $1,526 million gap to the $13.0 billion target, the company must generate a total of $6,104 million in free cash flow. This requirement stems from the current policy, which allocates 25% of FCF to the balance sheet and 75% to share buybacks .
Depending on commodity pricing and operational performance, the timeline to cross this threshold varies:
Accelerated Pace (Q2 2026 Record): At $2,975 million FCF per quarter, CNQ would hit the target in approximately 6.2 months (January 2027).
Base Case (H1 2026 Average): At $1,925 million FCF per quarter, the target is reached in 9.5 months (April 2027).
Conservative Pace: At $1,200 million FCF per quarter, the timeline extends to 15.3 months (October 2027.
Estimating the 100% Free Cashflow Return
Once the $13.0 billion net debt level is achieved, the 25% allocation to debt reduction ceases [cite: 1]. Using the H1 2026 average FCF generation of $1,925 million per quarter, the buyback funding will instantly increase by 33.3%, rising from $1,444 million to $1,925 million per quarter.
Expected Share Price Valuation at 100% Return
To estimate the expected share price following the pivot to a 100% FCF return, we evaluate the expanded total return against market yield expectations. Currently, CNQ supports a market capitalization of approximately $132 billion across its ~2,069 million outstanding shares.
With an estimated total annual capital return (dividends plus buybacks) surging to $12.87 billion under the H1 2026 average FCF pace, we project the following expected share prices based on standardized market return yields:
Conservative Yield Rerating (9.0% Return Yield): If the market prices CNQ to yield 9.0% on its total cash returns, the implied market capitalization would be $143.0 billion ($12.87B / 0.09). Divided by 2,069 million shares , the estimated expected share price is ~$69.12.
Benchmark Yield Rerating (8.0% Return Yield): If the market prices CNQ at a standard 8.0% mature energy return yield, reflecting confidence in the sustained 100% FCF payout, the implied market capitalization rises to $160.87 billion ($12.87B / 0.08). This results in an estimated expected share price of ~$77.75.
In conclusion, the elimination of the 25% balance sheet allocation requirement will fundamentally transform CNQ's equity value proposition. Investors tracking the $1,526 million debt gap can anticipate a powerful rerating catalyst in early-to-mid 2027 as the $13.0 billion net debt threshold is officially crossed.
* Additional data resources extracted from the company’s annual reports have been attached to this article for further financial context.
Articles you may like:
CNQ & The Chevron Heist: A Masterclass in Capital Allocation
Why Canadian Natural Resources' $6.5B acquisition was the ultimate value-investor's triumph.
Tracking the Smart Money: Why Insiders Are Quietly Backing Adobe Inc at Multi-Year Lows
Insider “Cluster Buying” and Quant Valuations for US & Canadian Equities.
High-conviction fundamental research and quantitative models for European, Asian, and Global Emerging Markets.
Fundamental analysis and Sovereign Wealth tracking for Saudi & UAE markets.


