

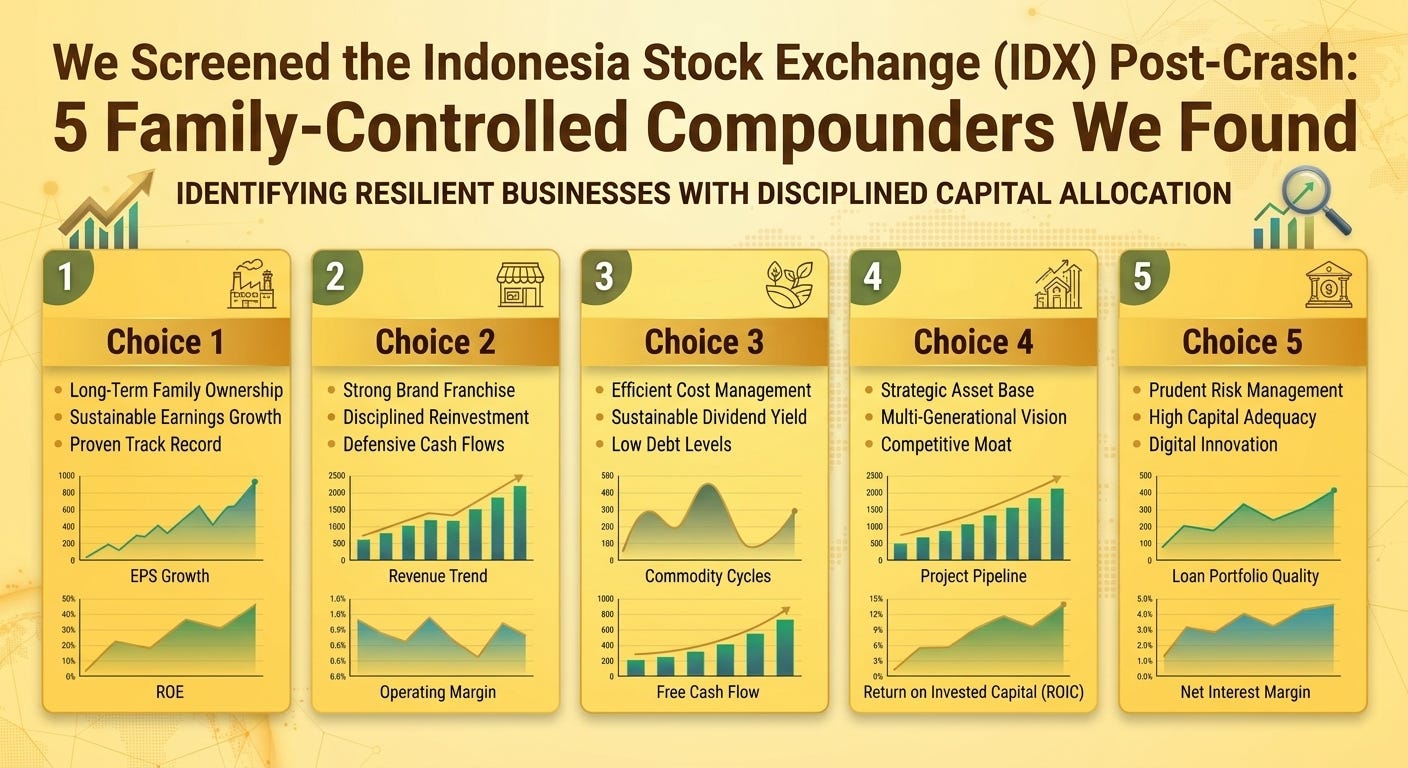
INSTITUTIONAL READING FORMAT NOTICE This report is an open-access institutional showcase from The Kingside Dossiers by The Global Gambit. Because email clients compress multi-column equity valuation tables and supply-chain schematics, we have published a dedicated Full-Screen Web Terminal Edition optimized for desktop and tablet reading.
The Macro Setup: Liquidity Shock vs. Fundamental Reality
During the October 2026 sell-off, the Jakarta Composite Index (IHSG) plunged nearly 15% in a single week—briefly triggering an exchange-wide trading halt—amidst institutional outflows and MSCI’s proposal to review Indonesia’s market classification.
When index-level forced selling hits an emerging market, correlations go to one. Institutional funds liquidating broad basket positions indiscriminately dump pristine, cash-rich operators right alongside over-leveraged cyclical companies.
We ran our quantitative screener across the Indonesia Stock Exchange (IDX) to isolate businesses that meet strict capital allocation criteria:
Ownership Structure: Founder or family-controlled with generational skin in the game.
Balance Sheet Fortress: Minimal to zero leverage (Net Cash or Debt/Equity < 0.25x).
Capital Efficiency: High Return on Invested Capital (ROIC > 15%) and durable operating margins.
Note: This list represents the initial output from our quantitative screener; we have not yet conducted a full deep-dive fundamental or forensic valuation analysis on these individual names.
Company Profiles & Screener Highlights
1. PT Industri Jamu dan Farmasi Sido Muncul Tbk (IDX: SIDO)
Industry: Consumer Healthcare & Herbal Pharmaceuticals
What They Do: Controlled by the Hidayat family, Sido Muncul is Indonesia’s dominant producer of traditional herbal medicine (jamu), wellness supplements, and functional beverages, anchored by its flagship Tolak Angin brand. The company controls the entire value chain from raw herbal extraction to nationwide retail distribution.
2026 Price Action & Sell-Off Correction:
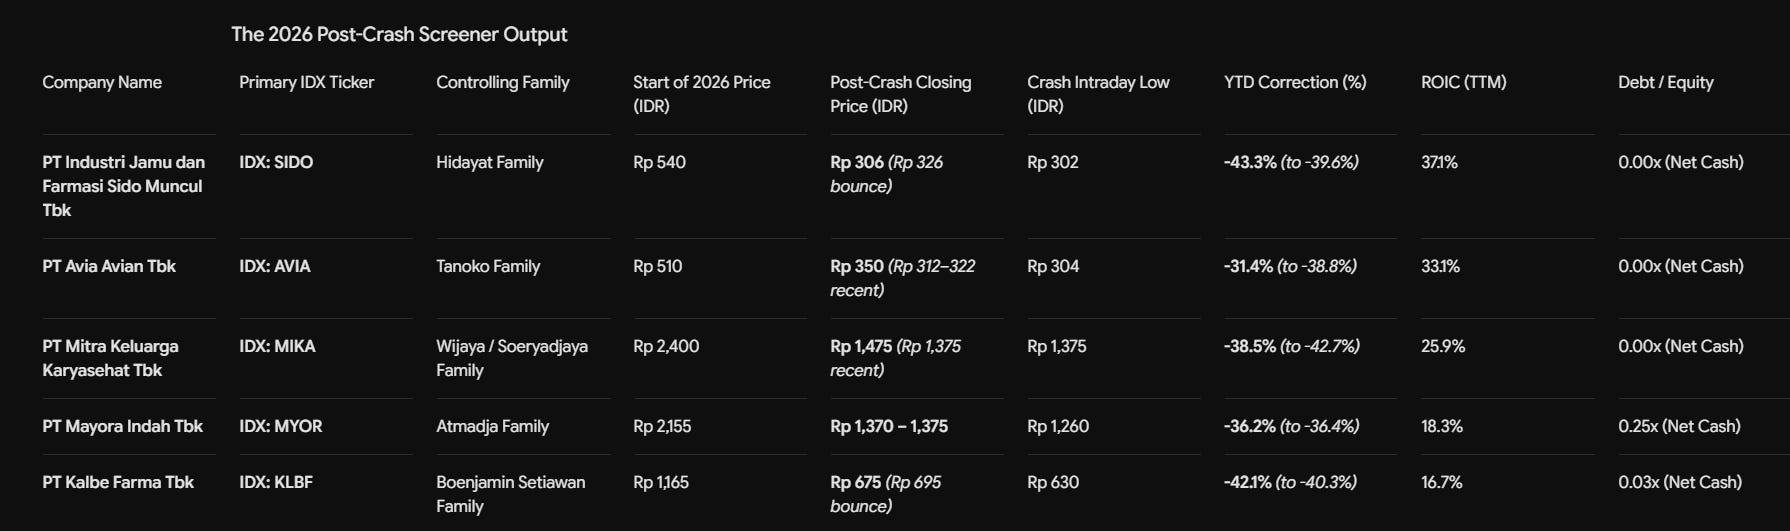
Start of Year 2026 Price: Rp 540
Pre-Crash October Price (Oct 14–15, 2026): Rp 354 – Rp 356
Crash Trough / Intraday Low (Oct 16, 2026): Rp 302 (52-week low)
Post-Crash Closing Price: Rp 306 (initial crash close) / Rp 326 (latest stabilized close)
Total Price Correction: Shares corrected -43.3% YTD at the Rp 306 post-crash level (-39.6% YTD at the Rp 326 bounce), including an acute -14.6% single-week liquidity drop during the October index rout on over 111 million shares of volume.
Screener Readout & The Opportunity: SIDO boasts the highest capital efficiency in our screen with an exceptional 37.1% ROIC and 32.2% operating margins, while carrying virtually zero debt (IDR 475B in cash vs. IDR 1.6B in total debt). Down 43.3% YTD to Rp 306, the market is pricing this compounding machine at ~9.4x trailing P/E and 6.5x EV/EBITDA, pushing its trailing dividend yield to ~12.1%.
Where It Is Listed & How to Buy:
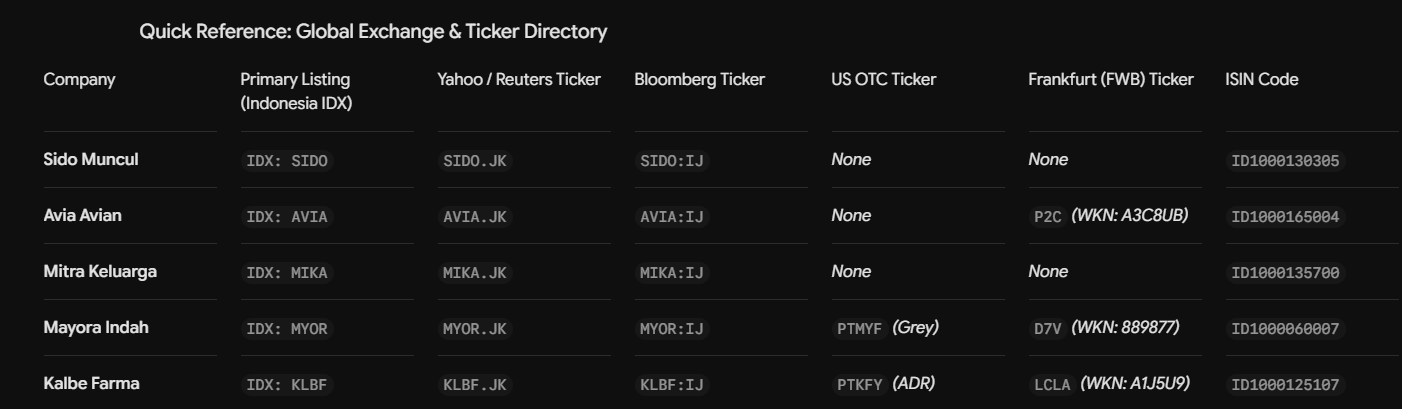
Primary Exchange: Indonesia Stock Exchange (IDX) — Ticker:
SIDO(Bloomberg:SIDO:IJ/ Reuters & Yahoo Finance:SIDO.JK/ TradingView:IDX:SIDO)Secondary / US OTC & European Listings: None (Pure-play domestic IDX listing).
ISIN:
ID1000130305Execution Note: Accessible directly in Indonesian Rupiah (IDR) via international brokers offering direct IDX routing (such as Interactive Brokers, PhillipCapital/POEMS, or Saxo Markets) in standard Indonesian board lots of 100 shares.
2. PT Avia Avian Tbk (IDX: AVIA)
Industry: Specialty Chemicals & Building Materials
What They Do: Founded and controlled by the Tanoko family (Hermanto Tanoko), Avia Avian is the market leader in Indonesia’s decorative paints, waterproofing, and architectural coatings sector. Its moat is built on an unmatched, wholly owned nationwide distribution network that supplies tens of thousands of traditional hardware stores directly.
2026 Price Action & Sell-Off Correction:
Start of Year 2026 Price: Rp 510
Pre-Crash October Price (Oct 14–15, 2026): Rp 350 – Rp 356
Crash Trough / Intraday Low (Oct 16, 2026): Rp 304
Post-Crash Closing Price: Rp 350 (entering the October halt) / Rp 312 – Rp 322 (post-rout closing range following its Oct 20 ex-dividend adjustment)
Total Price Correction: Shares corrected -31.4% YTD to Rp 350 entering the mid-October sell-off, and extended to a -36.9% to -38.8% total YTD correction (Rp 312–322) as forced institutional selling swept across mid-cap IDX leaders.
Screener Readout & The Opportunity: Generating a 33.1% ROIC and 50.3% gross margins, AVIA operates with a fortress balance sheet holding IDR 4.40 trillion in cash against negligible lease liabilities (net cash represents ~21% of its entire market cap). Following a 31.4% YTD decline to Rp 350, the stock trades at 10.9x P/E (and 6.6x EV/EBITDA) with a 6.9% dividend yield.
Where It Is Listed & How to Buy:
Primary Exchange: Indonesia Stock Exchange (IDX) — Ticker:
AVIA(Bloomberg:AVIA:IJ/ Reuters & Yahoo Finance:AVIA.JK/ TradingView:IDX:AVIA)European Secondary Listing: Frankfurt Stock Exchange (Börse Frankfurt / FWB) — Ticker:
P2C/ WKN:A3C8UB(Traded in EUR)US OTC Markets: No active US ADR or OTC ticker.
ISIN:
ID1000165004Execution Note: Institutional and retail liquidity is heavily concentrated on the primary Jakarta listing (
AVIA.JK). The Frankfurt (P2C) listing is an unsponsored secondary quotation with thin volume and wide bid-ask spreads.
3. PT Mitra Keluarga Karyasehat Tbk (IDX: MIKA)
Industry: Healthcare Facilities & Private Hospitals
What They Do: Backed by the founding family (Jozef Darmawan Angkasa / Wijaya family), MIKA operates one of Indonesia’s most profitable networks of multi-specialty private hospitals across Greater Jakarta, Surabaya, and high-density urban corridors in Java.
2026 Price Action & Sell-Off Correction:
Start of Year 2026 Price: Rp 2,400
Pre-Crash October Price: Rp 1,730
Crash Trough / Intraday Low (Oct 18–19, 2026): Rp 1,375 (new 52-week low)
Post-Crash Closing Price: Rp 1,475 (initial post-crash close, down -14.74% on the week) / Rp 1,375 (subsequent Monday close, down an additional -6.78%)
Total Price Correction: MIKA has suffered a -38.5% YTD drawdown at Rp 1,475 and a -42.7% YTD drawdown at its Rp 1,375 capitulation close—wiping out nearly Rp 1,025 per share from its start-of-year level despite stable inpatient fundamentals.
Screener Readout & The Opportunity: Unlike most capital-intensive hospital rollouts that rely heavily on debt, MIKA funds its greenfield hospital expansions entirely through internal cash flows. It holds IDR 3.02 trillion in cash with zero bank debt, generating a 25.9% ROIC and 31.6% operating margins. After a 38.5% drawdown to Rp 1,475, a premier healthcare operator that historically commanded 25x–30x earnings is now trading at 14.6x trailing P/E and 8.7x EV/EBITDA.
Where It Is Listed & How to Buy:
Primary Exchange: Indonesia Stock Exchange (IDX) — Ticker:
MIKA(Bloomberg:MIKA:IJ/ Reuters & Yahoo Finance:MIKA.JK/ TradingView:IDX:MIKA)Secondary / US OTC & European Listings: None (Pure-play domestic IDX listing).
ISIN:
ID1000135700Execution Note: Traded exclusively on the Indonesia Stock Exchange in IDR (
MIKA.JK). Requires an international brokerage account with direct Jakarta market access.
4. PT Mayora Indah Tbk (IDX: MYOR)
Industry: Packaged Foods & Beverages (FMCG)
What They Do: Run by the Atmadja family, Mayora Indah is a global Fast-Moving Consumer Goods powerhouse producing biscuits, coffee, wafers, and confectionery (including Kopiko, Torabika, and Danisa). Roughly half of its IDR 38.8 trillion revenue is generated outside Indonesia across more than 100 export markets.
2026 Price Action & Sell-Off Correction:
Start of Year 2026 Price: Rp 2,155 (with a 52-week peak of Rp 2,490 in February 2026)
Pre-Crash October Price (Oct 15, 2026): Rp 1,470
Crash Trough / Intraday Low (Oct 15–16, 2026): Rp 1,260 (new 52-week low during a -14.29% intraday flash drop)
Post-Crash Closing Price: Rp 1,370 – Rp 1,375
Total Price Correction: Down -36.2% to -36.4% YTD from the start of 2026 (and -44.9% from its February 2026 high of Rp 2,490). At the worst point of the October panic (Rp 1,260), shares had corrected -41.5% YTD before buyers stepped in to defend the Rp 1,370 level.
Screener Readout & The Opportunity: MYOR maintains an 18.3% ROIC and a net cash balance sheet (IDR 5.60 trillion in cash vs. IDR 4.55 trillion in total debt, D/E of 0.25x). Critically, because of its massive export footprint, a weaker Indonesian Rupiah acts as a natural margin tailwind via USD/foreign currency export receipts. Down 36.2% YTD to Rp 1,375, MYOR trades at 9.0x P/E and 5.1x EV/EBITDA.
Where It Is Listed & How to Buy:
Primary Exchange: Indonesia Stock Exchange (IDX) — Ticker:
MYOR(Bloomberg:MYOR:IJ/ Reuters & Yahoo Finance:MYOR.JK/ TradingView:IDX:MYOR)US Over-The-Counter (OTC): US OTC Grey/Pink Market (Ordinary Shares) — Ticker:
PTMYF(Traded in USD)European Secondary Listings: Frankfurt Stock Exchange (FWB) & Düsseldorf Stock Exchange — Ticker:
D7V/ WKN:889877(Traded in EUR)ISIN:
ID1000060007Execution Note: While
PTMYF(US OTC) andD7V(Frankfurt) exist for foreign investors without IDX routing, both trade by appointment with negligible daily volume. Direct execution on the IDX (MYOR.JK) is strongly preferred for tight spreads.
5. PT Kalbe Farma Tbk (IDX: KLBF)
Industry: Pharmaceuticals & Consumer Nutrition
What They Do: Founded by Dr. Boenjamin Setiawan and controlled by the Setiawan family, Kalbe Farma is Southeast Asia’s largest publicly listed pharmaceutical company. It operates across four synergistic divisions: prescription pharmaceuticals, over-the-counter (OTC) consumer health, clinical nutrition/dairy, and medical cold-chain distribution.
2026 Price Action & Sell-Off Correction:
Start of Year 2026 Price: Rp 1,165
Pre-Crash October Price (Oct 14, 2026): Rp 790
Crash Trough / Intraday Low (Oct 19, 2026): Rp 630 (new 52-week capitulation low)
Post-Crash Closing Price: Rp 675 (Friday crash close after a -14.56% single-day plunge) / Rp 695 (Tuesday October 20 recovery close)
Total Price Correction: KLBF suffered a -42.1% YTD correction at the Rp 675 crash close (-45.9% YTD at the Rp 630 intraday low on Oct 19), and sits -40.3% YTD following Tuesday’s bounce to Rp 695.
Screener Readout & The Opportunity: KLBF has compounded top-line revenue consistently (IDR 37.7 trillion TTM) while maintaining a net cash balance sheet (D/E of 0.03x) and a 16.7% ROIC. The October panic dragged shares down 42.1% from Rp 1,165 at the start of the year to multi-year lows around Rp 675—compressing the valuation of Indonesia’s blue-chip healthcare bellwether to ~8.5x trailing earnings and 0.9x price-to-sales.
Where It Is Listed & How to Buy:
Primary Exchange: Indonesia Stock Exchange (IDX) — Ticker:
KLBF(Bloomberg:KLBF:IJ/ Reuters & Yahoo Finance:KLBF.JK/ TradingView:IDX:KLBF)US Over-The-Counter (ADR): US OTC Markets (Unsponsored ADR) — Ticker:
PTKFY(Traded in USD; 1 ADR represents 200 underlying IDX ordinary shares)European Secondary Listing: Frankfurt Stock Exchange (Börse Frankfurt / FWB) — Ticker:
LCLA/ WKN:A1J5U9(Traded in EUR)ISIN:
ID1000125107Execution Note: Of the five companies in this screen, Kalbe Farma is the most accessible to US-based accounts via its unsponsored ADR (
PTKFY, currently trading near ~$7.40–$8.50 USD post-crash). However, investors should always use limit orders onPTKFYor execute directly on the primary Jakarta listing (KLBF.JK) where daily volume exceeds 70–140 million shares.
Bottom Line: Where Is the Opportunity?
The October 2026 IDX crash is a textbook example of an index-driven liquidity event punishing high-quality balance sheets. None of the five family-owned businesses in this screener rely on external capital markets to fund their operations; all five hold net cash positions and generate double-digit returns on invested capital.
When blue-chip, debt-free consumer and healthcare monopolies see their multiples compressed into the single digits (5x to 9x EV/EBITDA), it warrants moving them from the quantitative screener to the front of the research queue.
Disclaimer & Disclosure
The information contained in this publication is for informational and educational purposes only and does not constitute financial, investment, legal, or tax advice. The Global Gambit and its authors are not registered investment advisors, broker-dealers, or financial planners. Quantitative screener outputs, historical price actions, financial ratios, and preliminary data analyses reflect algorithmic filters applied to public exchange filings and do not constitute a formal recommendation or solicitation to buy or sell any security.
All investments in global equities, including emerging market listings on the Indonesia Stock Exchange (IDX), carry substantial risks of loss. Past performance, high historical ROIC, or pristine balance sheet metrics are never guarantees of future returns. Readers should conduct their own independent due diligence and consult with a licensed professional financial advisor before executing any investment strategy.
Position Disclosure: In accordance with our ethical standards, the authors and publishers at The Global Gambit do not own shares, options, or any financial interest in any of the companies mentioned in this publication at the time of writing.
The Cobalt Paradox: Structural Oversupply, DRC Export Quotas, and the 2027 Institutional Investment Outlook

INSTITUTIONAL READING FORMAT NOTICE This report is an open-access institutional showcase from The Kingside Dossiers by The Global Gambit. Because email clients compress multi-column equity valuation tables and supply-chain schematics, we have published a dedicated
Champion Iron Limited (TSX: CIA) — High-Purity Moat, DRPF Inflection, and Asymmetric Value

Position Disclosure & Legal Disclaimer