

In the autumn of 2021, Floor & Decor Holdings (NYSE: FND) received the ultimate institutional stamp of approval. When Berkshire Hathaway’s third-quarter Form 13F filing hit the SEC EDGAR database in November 2021, it revealed that Omaha’s capital allocators had initiated an 817,000-share stake in the specialty hard-surface flooring retailer. Over the next two quarters, Berkshire aggressively scaled the position to 4.78 million shares—representing roughly 4.5% of the company.
To growth-oriented equity investors, the thesis looked bulletproof: a category-killing warehouse model with 80,000-square-foot footprints, direct-from-manufacturer sourcing, and an ambitious runway to expand from roughly 150 stores to 500 nationwide. Buoyed by pandemic-era stimulus, rock-bottom mortgage rates, and a frenzy of suburban remodeling, FND’s stock peaked near $140 per share in late 2021.
Yet within three years, the fundamental engine driving Floor & Decor deteriorated with startling speed. By late 2024, Berkshire Hathaway had liquidated every single share. For investors who treated the Berkshire 13F disclosure as a permanent “buy-and-hold forever” endorsement rather than examining the quarterly MD&A disclosures, the aftermath was brutal: a violent valuation reset that saw FND shares collapse more than 65% from their peak (and fall over 55% from their 2024 highs into the mid-$40s by late 2026).
1. The Anatomy of a Cyclical Boom Mistaken for Secular Growth
When Berkshire’s portfolio managers accumulated their FND stake between Q3 2021 and Q1 2022, Floor & Decor’s financial statements looked like those of a compounding juggernaut. In FY2021, net sales surged 41.5% to $3.43 billion, driven by a staggering 27.6% increase in comparable store sales. Even in FY2022, as the Federal Reserve began hiking interest rates, FND posted a 9.2% comparable store sales gain, pushing diluted EPS to a record $2.78 and operating margins to 9.3%.
However, those peak metrics were heavily juiced by two macroeconomic anomalies that were about to reverse simultaneously:
Pull-Forward Remodeling Demand: Lockdowns and home-equity windfalls compressed years of discretionary home upgrades into a 24-month window.
Existing Home Turnover Velocity: Hard-surface flooring is heavily tied to residential real estate transactions—homeowners disproportionately replace tile, wood, and laminate right before listing a house or immediately after buying one.
When 30-year U.S. fixed mortgage rates surged past 7%, the “lock-in effect” froze the U.S. housing market. Homeowners sitting on 3% mortgages refused to sell, driving existing home sales to 30-year lows. Almost overnight, Floor & Decor’s primary demand catalyst evaporated.
2. The Velocity of Metric Deterioration (2022–2026)
What caught consensus estimates off guard was not merely that growth slowed, but the sheer velocity with which Floor & Decor’s unit economics reversed. Because FND operates massive warehouse stores with high fixed occupancy, payroll, and depreciation costs, its income statement is highly sensitive to same-store sales volume.
As existing home turnover stalled, FND’s core performance metrics broke down across four distinct vectors:
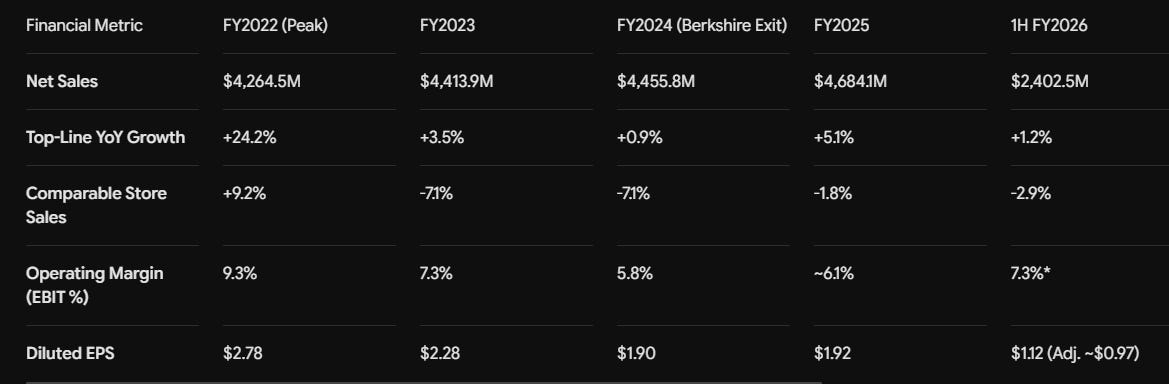
*Note: 1H FY2026 GAAP operating margin and EPS included non-recurring tariff refund/litigation adjustments; Adjusted Diluted EPS for FY2026 was guided to just $1.88–$2.13.
The Illusion of Top-Line Stability
Looking strictly at top-line revenue, an observer might see a business that grew net sales from $4.26 billion in 2022 to $4.68 billion in 2025. In reality, that top-line growth was entirely manufactured by capital-intensive unit expansion—opening roughly 20 to 35 new stores per year—while the existing store base was actively shrinking.
Comp-Store Collapse: After posting +9.2% comps in FY2022, comparable store sales swing by more than 16 percentage points into negative territory, printing -7.1% in FY2023 and -7.1% again in FY2024, followed by -1.8% in FY2025 and -2.9% in the first half of FY2026.
Severe Operating Deleverage: Remarkably, FND’s merchandising team actually expanded gross margins during the downturn (rising from ~40% in 2022 to 43.3% in 2024 and nearly 44% on an adjusted basis in 2026). Yet it did not matter. Opening dozens of sprawling new warehouses into a shrinking demand environment caused Selling, General, and Administrative (SG&A) expenses and depreciation to balloon as a percentage of revenue. Operating margins were sliced by more than a third, falling 350 basis points from 9.3% in FY2022 to 5.8% in FY2024.
Capex Throttle & Growth Walk-Back: For years, management anchored its premium valuation on opening 35+ stores annually on a path to 500 locations. As cash flows tightened and new store productivity lagged, management was forced to repeatedly slash its unit growth targets—cutting annual store openings down to 20 stores in FY2025 and FY2026 while curtailing capital expenditures by roughly 50% from peak levels.
3. The 2024 Valuation Trap—And Berkshire’s Disciplined Exit
Perhaps the most instructive phase of the Floor & Decor saga occurred during the first three quarters of 2024.
In Q1 2024, FND’s comparable store sales plunged 11.6%, followed by a 9.0% drop in Q2 2024. Fundamentally, the business was contracting at its fastest pace since the 2008 housing crash. Paradoxically, the stock market ignored the income statement. Convinced that the Federal Reserve was on the verge of an aggressive rate-cutting cycle that would instantly reignite housing turnover, Wall Street bid FND shares up to $126 in March 2024 and kept the stock elevated near $100–$120 through the third quarter.
At $120 per share on $1.90 of earnings, Floor & Decor was trading at 63x trailing earnings—a hyper-growth software multiple attached to a cyclical, capital-intensive brick-and-mortar retailer posting -9% same-store comps.
Inside Berkshire Hathaway, portfolio managers Ted Weschler and Todd Combs recognized the gift the market was handing them:
Q2 2024: As comps fell 9.0% and the stock hovered near $100–$120, Berkshire trimmed its stake by 16.8% (~802,000 shares).
Q3 2024: As comps fell another 6.4% and the stock rallied back above $120 in September 2024, Berkshire dumped its remaining 3.98 million shares, exiting the investment near its original 2021–2022 cost basis ($101–$119/share).
Berkshire didn’t wait for a housing recovery that kept getting pushed out on the horizon. When the fundamental thesis broke and the market offered a rich exit liquidity window, they took it without hesitation.
4. The Inevitable Multiple Compression (2025–2026)
Once the rate-cut euphoria of late 2024 faded and sticky long-end Treasury yields kept mortgage rates elevated through 2025 and 2026, gravity caught up with Floor & Decor’s equity valuation.
Without the “Berkshire halo” or accelerating store openings to justify a 50x–60x P/E ratio, the market began repricing FND as a mature, cyclical retailer rather than an unstoppable compounder:
Throughout 2025, as same-store sales failed to inflect positively (-1.8% for the full year) and management cut store opening guidance to 20 units, the stock slid from $100 in January 2025 down to $60 by November 2025.
By October 2026, with comparable store sales still negative (-2.9% through 1H 2026) and full-year comp guidance projecting flat to -4.0%, FND compressed all the way to $45 per share—a 21x P/E multiple that erased more than $10 billion in peak market capitalization.
Key Takeaways for Fundamental Analysts
The rise and fall of Floor & Decor serves as a textbook case study in institutional coat-tailing and retail unit economics:
Never Outsource Conviction to a 13F: A position representing 0.1% of Berkshire Hathaway’s equity portfolio is a tactical sleeve allocation by Weschler or Combs, not an permanent structural holding like American Express or Coca-Cola. When the facts changed, Berkshire sold silently—and retail investors only found out 45 days after the quarter ended.
Watch Comps, Not Just Store Count: Rapid unit expansion can mask severe organic decay on the consolidated revenue line. Whenever a retailer’s top-line growth is positive solely because of new store openings while comparable store sales are deeply negative, fixed-cost deleverage will inevitably crush operating margins.
Respect Valuation Gravity in Cyclicals: Paying 55x trough earnings for a housing-dependent retailer leaves zero margin of safety if the macro cycle stays frozen longer than expected. When both earnings and the multiple compress simultaneously, the resulting drawdown is unforgiving.
Initiation of Coverage: Halyk Bank of Kazakhstan (HSBK)

Section 1. Corporate Profile & Capital Structure
FirstService Corporation (FSV): An Overlooked Compounding Machine (Initiating Coverage)

INVESTMENT SUMMARY & QUICK FACTS
Canadian Natural Resources Ltd. (CNQ) — Revenue Streams & Product Sales Analysis

Canadian Natural Resources Ltd. (CNQ) is a senior independent energy company engaged in the acquisition, exploration, development, production, marketing, and sale of crude oil, natural gas, and natural gas liquids (NGLs). The company’s premium asset portfolio spans Western Canada, the North Sea, and Offshore Africa.
CNQ & The Chevron Heist: A Masterclass in Capital Allocation

There is a stark difference between management teams that run companies for executive incentives and those that operate with true inside skin in the game. In the energy sector, capital allocation is the ultimate arbiter of long-term survival. You don’t build generational wealth by simply pulling hydrocarbons out of the ground; you build it by acquiring …
Disclaimer
This article is for informational, educational, and illustrative purposes only and does not constitute financial, investment, or legal advice. The historical financial data, dates, and valuations referenced are based on publicly available filings and market metrics; however, stock performance and corporate circumstances may change over time. Readers should conduct their own research or consult with a licensed financial adviser before making any investment decisions. The author and publisher are not affiliated with Berkshire Hathaway, Floor & Decor Holdings, or any of their subsidaries, and do not hold positions in the mentioned securities at the time of publication.